
ITM 6 as a Business Service Viewer
Most users of Tivoli Monitoring tools have become accustomed to viewing simplistic event lists rather than the graphical event statuses available with some other vendor’s Systems Management tools. However with the introduction of IBM Tivoli Monitoring (ITM) 6 customers can now display logical views that, with a little work, can be used to display key Business Services.
This is something that most customers have wanted however have been loathe to make the investment needed to buy IBM’s TBSM or Managed Object’s Formula products because the functionality delivered by these two products is way above that required. However in the majority of installations we have been involved with we have found that a simple service status view is all that is required.
Logical Views
There are two types of views that can be used:
- Logical Units displayed on a map
- Logical Items displayed on an Image/Blank screen
For example if you have a branch network or regional sites you might want to display these on a map. ITM 6.1 uses a geo-referenced map which is a special type of graphic that has built-in knowledge of latitude and longitude and can be zoomed into and out of quickly. The Portal uses proprietary .IVL files that cannot be opened or saved in a graphic editor. In the example below we are using a pre-supplied .IVL file called united_kingdom_ireland and a default style sheet called default.css that generates the items displayed on the map; In this case server images. More of these later.
A second example, and one that we are finding more popular amongst the customers we are visiting, is a representation of services as logical units. Typically this would be a Business Service View which could represent services that are made up of many applications and physical servers. For example a Bank may want an object to display the service for Internet Banking. In other words “Can our customers use Internet banking or not?” In the example below we have used a image called orb-data.jpg as the background. This could be any image but would typically be quite simple so as to not interfere with the service views.
As said previously the style of the view is defined using Cascading Styles sheets or .css files. These external style sheets enable you to change the appearance and layout of all pages by editing one single CSS document. The style sheet used here (OrbData_Top_Level.css) defines two objects; firstly the rectangular box and secondly the small circular icon in the corner. This is a monitor to show that the infrastructure that creates these views is working (i.e. TEP Server, TEMS, and TEC).

Once these views have been defined it is two simple steps to make them reflect the situations and systems you want:
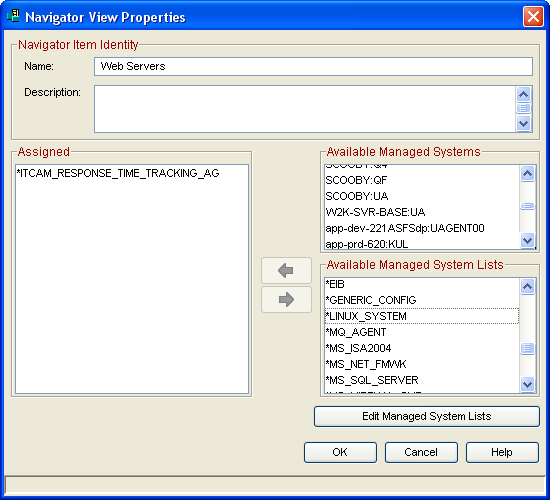
- Step 1: From the logical item properties window assign the system or managed system lists associated with the service you want to monitor.
- Step 2: From the logical item situations choose the specific situations you have chosen to reflect the service’s status and Associate it with the logical item.
Linking to a Sub-View
Each view that you create can also be linked to sub-views so that you can click on a service and be shown a view of the sub-services. For example Internet Banking might be linked to a view showing the infrastructure that makes up this service and this could be displayed on the desktops of the support team that deals with this service.
This is performed by right clicking on the item in the Graphic View and select “Link to -> Link Wizard” and following the wizard instructions.
Is it really that simple?
Well not quite. If you are only using ITM 6 and you want every event to be reflected in the view then these simple displays will be enough however there are two circumstances where more work will be needed:
- Legacy Events – Events that are delivered through the Tivoli Enterprise Console (TEC) (or any 3rd party tool) such as NetView will not update the TEP and will therefore not be displayed as part of the Logical views.
- Service Logic – Not all events will cause a service to be unavailable and therefore merely assigning a situation (an event) to a logical item will not give a clear picture as to whether that service is up or down.
Legacy TEC Events
ITM 6.1 logical views provide no route for incoming TEC events to impact icons, views and situations in the TEP. As events from items such as NetView and adapters must feed the infrastructure-base service views, a mechanism is required to convert them to ITM 6 Situations and thus drive the icon changes. An Icon in the TEP is changed by the following process:
- A Situation status changes, e.g. a Situation is raised
- The icon is checked to see if the ManagedSystem linked to the Situation is assigned to it
- The icon is checked to see if this Situation is associated with it
- The Situation status is reflected in the Icon
Only 2 criteria of a situation determine which icons it can affect – Managed System and Situation Name.
Therefore to extract TEC events into an ITM 6 Managed System Attribute Group we have defined a mechanism using an ODBC data provider Universal Agent to extract data. This is represented in the TEP as an Attribute Group of a Managed System as defined by the Universal Agent metafile.
This creates a single Managed System with all the data in it. We then create multiple situations (at least one per icon) to drive multiple icons.
Using Logic to change icons
There are cases where although an alert has fired you might not want a service to be marked as down. For example if are monitoring if the Web Servers service is up (green) or down (red) we probably don’t want a 100% CPU alert to be shown as causing the Web Servers service to be down? You want to know it is happening but it does not cause the service to be down. ITM 6.x allows for this to be achieved without using TEC rules by using Situation Comparisons andCorrelate Situations Across Managed Systems.
Situation Comparisons
A Situation Comparison is a specific type of situation that compares the results of other situations that have been distributed to a 1 or more systems. All of the situations that are compared must be distributed to all systems.
For example we could create a situation called WebServers that would check if any of MS_Offline, UDB_Status_Warning, and NT_Paging_File_Critical is true. In other words it is an OR comparison.
Whereas in this example the situtaion will fire if MS_Offline, UDB_Status_Warning, and NT_Paging_File_Critical all fire together. In other words it is an AND comparison.
These Situation Comparisons will need intervals set and then be distributed to be active. If you try and compare a situation that had not been distributed to all the systems that the Situation Comparison is sent to then these will be distributed automatically.
Correlate Situations Across Managed Systems
Correlate situations across Managed Systems will compare a single situation across multiple systems. For example if we wanted to create a situation that will check whether the WebServers situation has fired on more than one system we would use Correlate situations across Managed. This is particularly useful when you are using load balanced servers or when a single server failure does not cause the service to be down.
To do this we must assign a system against the logical item we are using (e.g. Web Servers) and then create the situation against the logical item. In this case associating a previously created situation will not work.
Views: 95