
If you are serious about monitoring your business services it is not enough to just look at the performance of your traditional IT hardware and software services. You also need to look at external forces that may affect your business from weather to social media to news sentiment. I’ve recently been looking at all of these subjects but this blog will concentrate on a simple method for monitoring the future weather at your business locations. For some businesses this is more important than others; if you have remote sites (such as ATMs, cell sites, factories, data centres, distribution centres, etc) that could cause loss of service or supply chain issues if they are out of service then you should be monitoring the weather in those locations so that you can mitigate these issues. As climate change becomes more extreme these issues will only become more prevalent with larger and more frequent storms, more flooding and increased likelihood of Forest Fires.
Even in the UK, a country not noted for weather extremes, we are starting to see these issues become more frequent. I worked at a company that had positioned its main data centre in Tewkesbury which was fine until in 2007 there were major floods which were repeated in 2012 and 2019.
In 2016 the Vodafone UK data centre was flooded over Christmas which lead to a disruption to their services.
With this in mind, this blog shows a simple way of using a python script to monitor the forecasted weather in your locations. The script then sends alerts to a socket probe in Netcool before displaying the data in a Grafana map and a Netcool event list.
Getting the Data
There are a few APIs that offer weather information, but I chose OpenWeatherMap.org as they offered a free starting tier that allows for development with up to 60 calls/minute and 1,000,000 calls/month. This may not be enough for your requirements, but you can see the pricing here if you want to make more calls or get more detailed data. The other advantage to openweathermap.org is that they offer what they call “a one call” API that provides the following weather data for any geographical coordinates:
- Current weather
- Minute forecast for 1 hour
- Hourly forecast for 48 hours
- Daily forecast for 7 days
- National weather alerts
- Historical weather data for the previous 5 days
The 2 items that were important for this purpose were the daily forecast and National weather alerts that are sent from major national weather warning systems. These latter alerts are generally provided in English but as they are local warnings they could be in the local language of the provider. Items 1-3 and 6 are not useful for alerting and can be excluded from the API call which is made as follows:
https://api.openweathermap.org/data/2.5/onecall?lat={lat}&lon={lon}&exclude={part}&appid={API_key}
Note: You will need to register to get the API key before you can use it.
Therefore, we want 2 types of data:
Daily
The daily data is provided as follows (the data has been cut down for simplicity):
'daily': [
{'dt': 1634616000, 'sunrise': 1634597595, 'sunset': 1634639375, 'moonrise': 1634637300, 'moonset': 1634592720, 'moon_phase': 0.45, 'temp': {'day': 296.18, 'min': 292.32, 'max': 297.54, 'night': 295.74, 'eve': 296.97, 'morn': 292.44}, 'feels_like': {'day': 296.71, 'night': 296.43, 'eve': 297.57, 'morn': 292.75}, 'pressure': 1017, 'humidity': 83, 'dew_point': 293.14, 'wind_speed': 2.93, 'wind_deg': 319, 'wind_gust': 5.79, 'weather': [{'id': 804, 'main': 'Clouds', 'description': 'overcast clouds', 'icon': '04d'}], 'clouds': 100, 'pop': 0.24, 'uvi': 0},
{'dt': 1634702400, 'sunrise': 1634684019, 'sunset': 1634725730, 'moonrise': 1634725680, 'moonset': 1634682180, 'moon_phase': 0.5, 'temp': {'day': 302.93, 'min': 295.13, 'max': 305.06, 'night': 298.19, 'eve': 301.62, 'morn': 295.42}, 'feels_like': {'day': 306.56, 'night': 299.18, 'eve': 305.07, 'morn': 296.18}, 'pressure': 1013, 'humidity': 65, 'dew_point': 295.65, 'wind_speed': 5.84, 'wind_deg': 143, 'wind_gust': 9.7, 'weather': [{'id': 804, 'main': 'Clouds', 'description': 'overcast clouds', 'icon': '04d'}], 'clouds': 100, 'pop': 0.21, 'uvi': 0},
{'dt': 1634788800, 'sunrise': 1634770443, 'sunset': 1634812086, 'moonrise': 1634814120, 'moonset': 1634771640, 'moon_phase': 0.52, 'temp': {'day': 291.55, 'min': 291.55, 'max': 298.05, 'night': 291.98, 'eve': 292.32, 'morn': 297.58}, 'feels_like': {'day': 291.72, 'night': 291.82, 'eve': 292.22, 'morn': 298.59}, 'pressure': 1017, 'humidity': 87, 'dew_point': 289.42, 'wind_speed': 8.77, 'wind_deg': 36, 'wind_gust': 15.51, 'weather': [{'id': 502, 'main': 'Rain', 'description': 'heavy intensity rain', 'icon': '10d'}], 'clouds': 100, 'pop': 1, 'rain': 37.5, 'uvi': 0},
…
{'dt': 1635220800, 'sunrise': 1635202572, 'sunset': 1635243881, 'moonrise': 1635258660, 'moonset': 1635219300, 'moon_phase': 0.67, 'temp': {'day': 295.95, 'min': 293.24, 'max': 296.42, 'night': 294.24, 'eve': 296.17, 'morn': 293.33}, 'feels_like': {'day': 296.06, 'night': 294.13, 'eve': 296.36, 'morn': 293.47}, 'pressure': 1019, 'humidity': 68, 'dew_point': 289.84, 'wind_speed': 4.77, 'wind_deg': 17, 'wind_gust': 10.15, 'weather': [{'id': 804, 'main': 'Clouds', 'description': 'overcast clouds', 'icon': '04d'}], 'clouds': 90, 'pop': 0, 'uvi': 0}]}
Alerts
And the alerts data is provided as follows:
    "alerts": [
    {
      "sender_name": "NWS Tulsa",
      "event": "Heat Advisory",
      "start": 1597341600,
      "end": 1597366800,
      "description": "...HEAT ADVISORY REMAINS IN EFFECT FROM 1 PM THIS AFTERNOON TO\n8 PM CDT THIS EVENING...\n* WHAT...Heat index values of 105 to 109 degrees expected.\n* WHERE...Creek, Okfuskee, Okmulgee, McIntosh, Pittsburg,\nLatimer, Pushmataha, and Choctaw Counties.\n* WHEN...From 1 PM to 8 PM CDT Thursday.\n* IMPACTS...The combination of hot temperatures and high\nhumidity will combine to create a dangerous situation in which\nheat illnesses are possible.",

      "tags": [
        "Extreme temperature value"
        ]
    },
    ...
  ]
Data Analysis and Conversion
There are a few things to note about this data.
- Firstly, all dates are provided as Unix time (UTC time zone) which need to be converted.
e.g.
timestamp = datetime.datetime.fromtimestamp(time)
curr_time = timestamp.strftime('%d/%m/%Y %H:%M:%S')
*where time is the Unix time.
- Secondly, if the forecast does not include rain or snow, they are simply not returned at all so you need to test for their existence before getting the value.
- All data is returned as standard metric measurements by default. This can be changed to imperial measurements, but this is important as the default temperature is Kelvin (which I convert to Celsius) and wind speed is metre/sec (which I leave) rather than miles per hour.
- As you may have noticed the OpenWeatherMap one call API call needs to be made using longitude and latitude instead of a location name. This has its advantages as it gives some accuracy to the location but is a pain for my script as I wanted to create the config file using place names for simplicity. Therefore to do this I used the Nominatim API. Nominatim is a geocoder that can identify geometries in OSM data corresponding to a given string. In this example Python code I supply a city name and get 2 variables back: location.latitude and location.longitude. Occasionally this API times out and so you would need to allow for that in your script.
e.g.
import geopy
from geopy import Nominatim
city_name = “Bangkok”
locator = Nominatim(user_agent="myGeocoder")
location = locator.geocode(city_name)
logging.info("Latitude: {}, Longitude: {}".format(location.latitude, location.longitude))
Configuration
I wanted to make the configuration file (in my case config.ini) as simple as possible and so it has only 5 sections. I may add more based on customer requirements later but for now this is enough. These are the sections:
GENERAL
This section has a polling interval, a customer name to be used if you have multiple customers (as we do) and an alerts parameter to allow for the Critical National Weather alerts to be turned off. The polling interval in my example is 15 minutes (900 seconds) but this could be much larger as the forecast does not change too often.
e.g.
[GENERAL]
poll=900
customer=ORB
alerts=TRUE
GEO
The GEO section is a comma-separated list of placenames. You can put in as many as you want but remember the limitation on calls per day.
e.g.
[GEO]
locations=Manilla,Hanoi,Goleta,Volusia,Kamchatka Krai,Goiano
LOGFILE
The log parameter contains the location of the log.
e.g.
[LOGFILE]
log=weather.log
SERVER
This section is the location of the server containing a socket probe to receive any alerts. This is an IP/Hostname and a port.
e.g.
[SERVER]
host = 191.1.1.1
port = 9595
DAILY_THRESHOLDS
As I said earlier the script checks both the daily forecasts and national alerts. The alerts do not need any configuration but to create alerts from the forecasts you need to add thresholds for what you consider unacceptable conditions. Most of the parameters are greater than (gt) but I also included one less than (lt) for temperature as a sudden freeze could also include issues for remote sites both for access and potential damage to IT equipment. You can add your own thresholds as you see fit. Remember when setting these values that they need to match the units you are retrieving the data (e.g. metres per second for wind speed).
e.g.
[DAILY_THRESHOLDS]
rain_gt = 10
snow_gt = 10
wind_gt = 12
temp_gt = 40
temp_lt = -5
humidity_gt = 90
pressure_gt = 1000
Execution and Data Flow
The simplest way to describe how the script works is to look at the flowing whiteboard diagram.
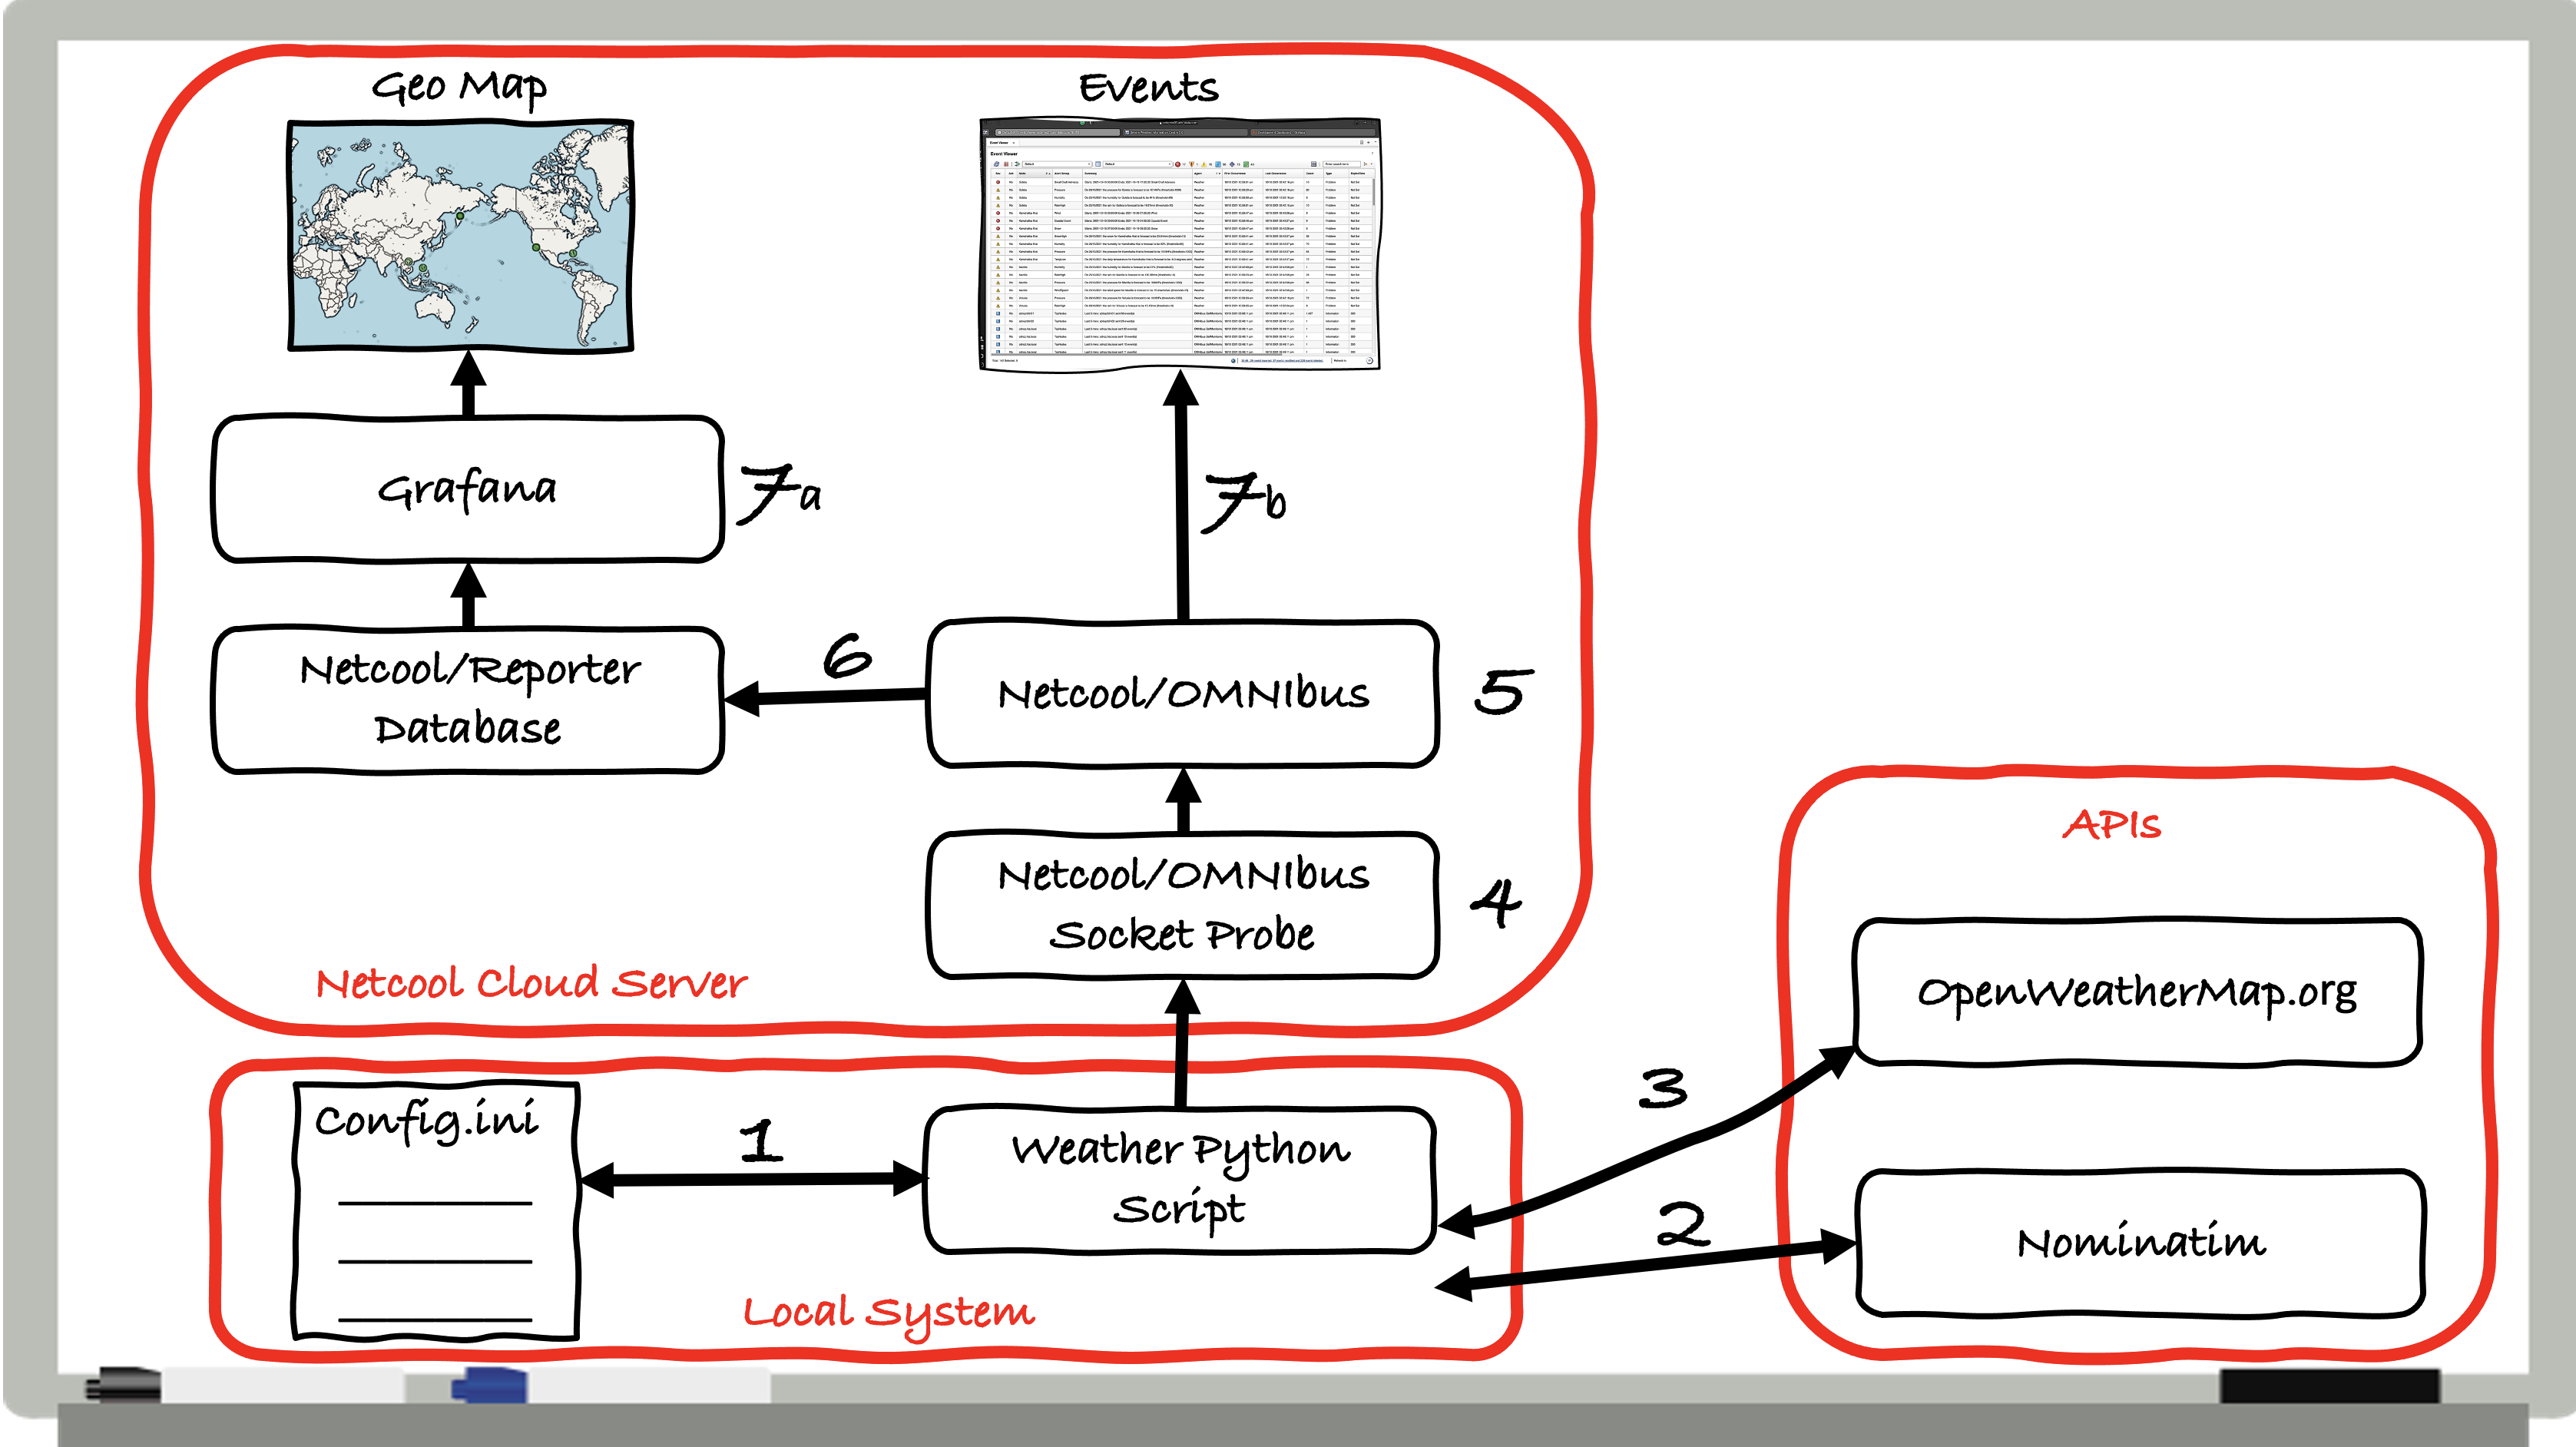
Let’s start with the execution of the script.
- The script can be executed anywhere as either a long-running daemon type process or scheduled intermittently as a one-off. I chose the former as was easier to allow for the polling interval to be added to the config file (which I called config.ini). Once it is run it looks for the config file and gets the GEO locations to report on, the thresholds to alert upon and the location to send alerts to. In my example, this script can be located anywhere, even on a laptop with internet access.
- The locations are retrieved and converted into longitude and latitude from the Nominatim API.
- For each named location (now longitude and latitude) the One Call API is run against OpenWeatherMap.org and the data is retrieved.
- The script will then cycle through this data and based on thresholds retrieved from the config file send Warning alerts via a socket connection to the Socket Probe. I have used this as an example, but the alerts could be sent using any other mechanism such as email or via another monitoring products API. It will also check if there are any National Weather alerts and send those too. In my example, they are sent as Critical. I made quite a few changes to the socket_java.rules file to ensure the Tokens I send get put in the correct Columns. For example, I assign the place name into Node, the alert type into Alert Group (including the auto-generated alert description from National Weather Alerts), the alert description into Summary and hard code the Agent as Weather.
- The alerts are then forwarded to Netcool/OMNIbus.
- And then stored in the Reporter database.
- Lastly, they are displayed either in a) Grafana or b) as events in a Netcool Event View. Examples of these are shown below:
The Grafana dashboard takes the alerts from the Reporter Database and displays them using longitude and latitude. This is a simple example, but the display could be changed to your design with a little bit of work. To the right of the dashboard you can see an alert type of “Small Craft Advisory”. This alert was issued because of the California fires making certain areas inaccessible.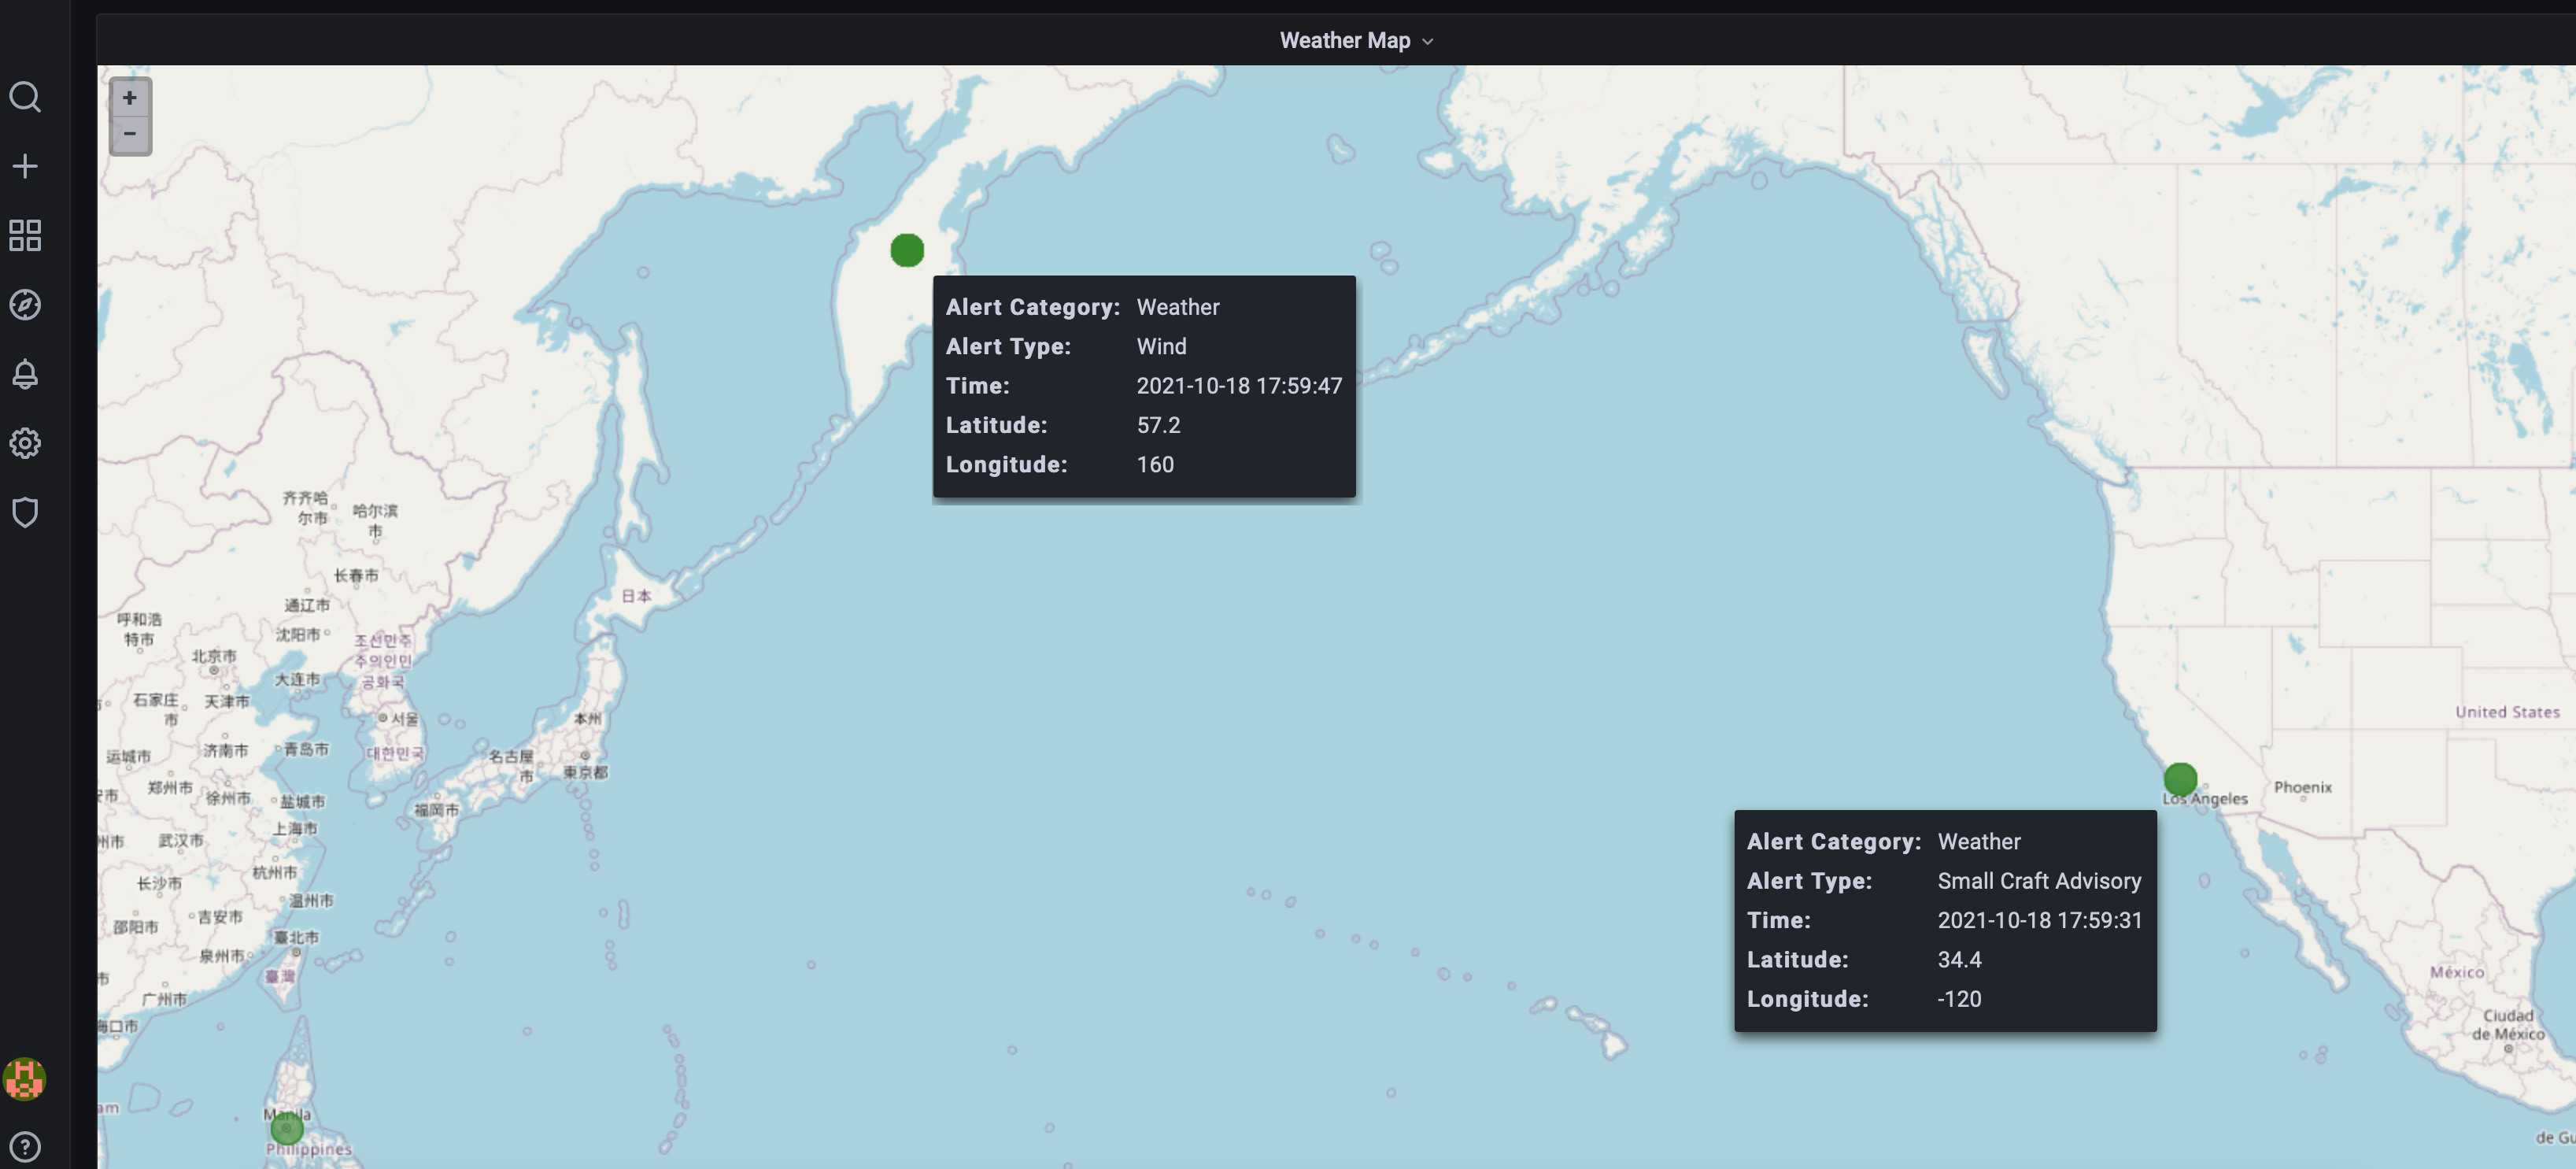
The Alerts view will show the base alerts. In this example, you can see both the threshold driven alerts (Warnings) and the National Weather alerts (Critical). In the example of the location Kamchatka Krai we can see that these alerts correlate in that we have Advisories for a Coastal Event, Snow and Wind and threshold alerts for SnowHigh and TemperatureLow.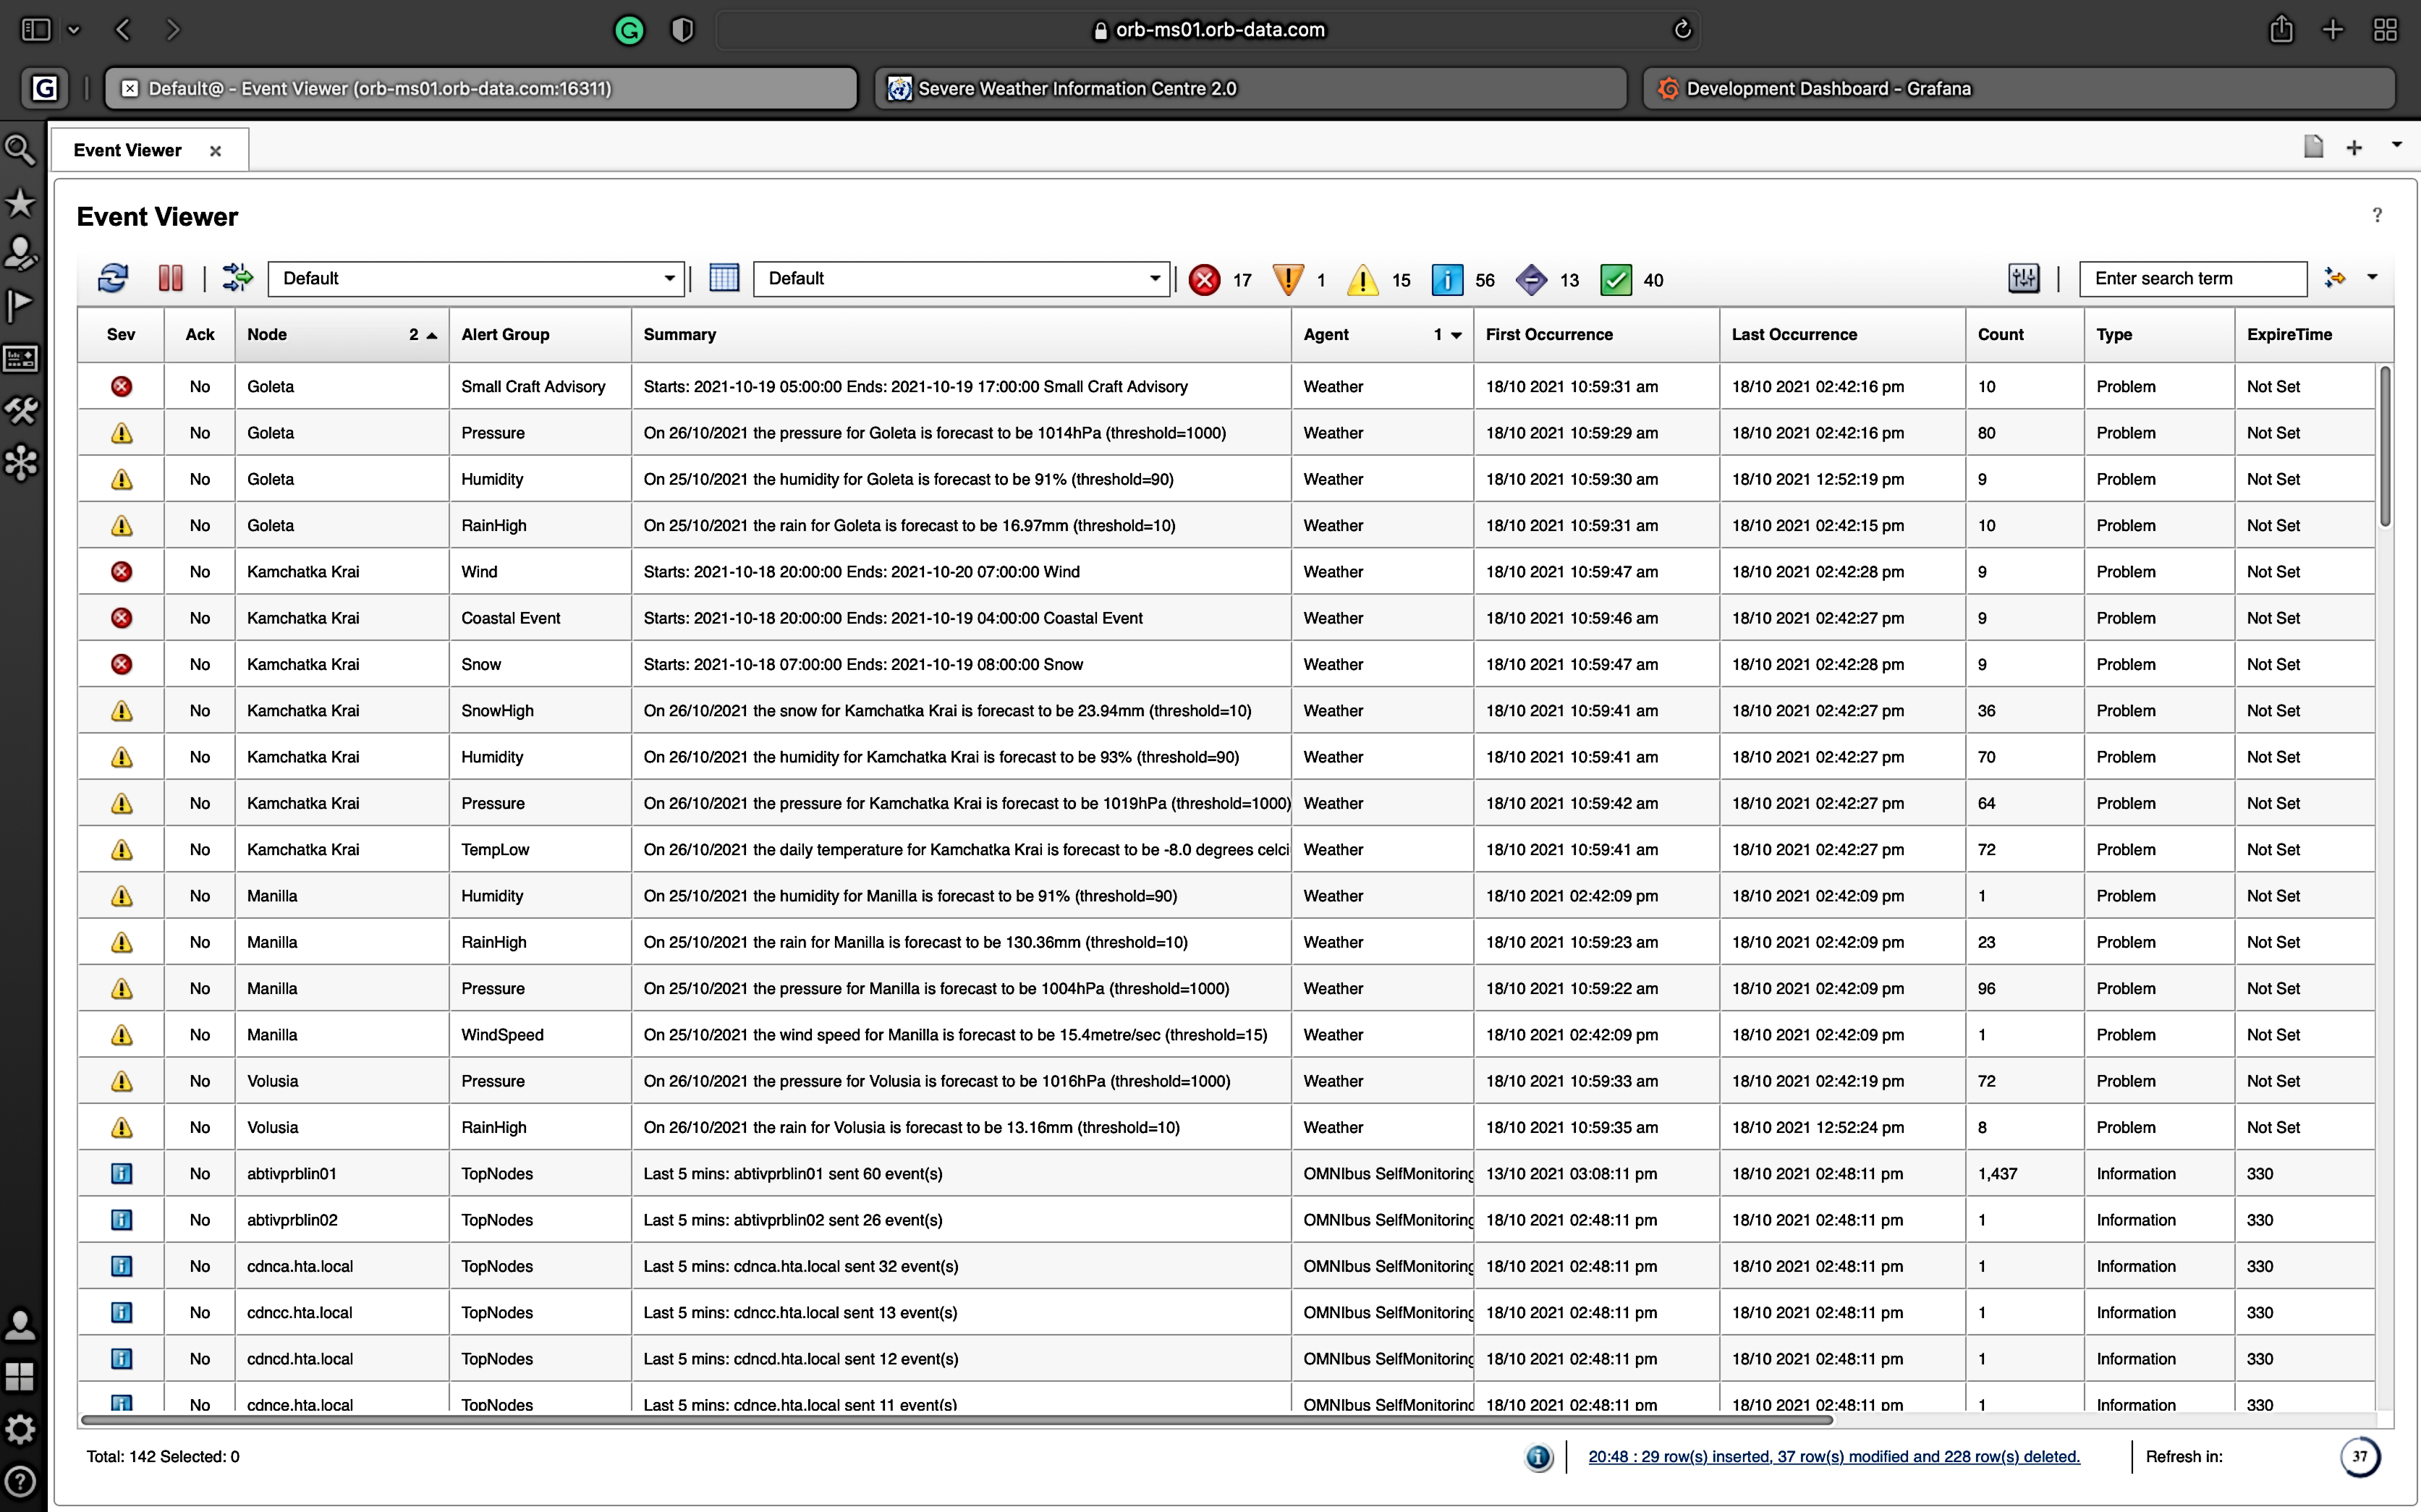
I haven’t provided the script in this blog as this work was created for a customer however if you would like something similar, we can modify the work to meet your requirements and provide a completed solution. Alternatively, feel free to create your own solution based on the ideas I have shown here.
If you have questions, please don’t hesitate to contact me.
Views: 365