
When the media discuss carbon footprints it’s often in conjunction with images of aeroplanes, traffic jams or smoking chimney stacks but very rarely do they blame IT for the world’s issues. However, the reality is very different. I was reading an article about the digital currency Ethereum and how a recent change called the Merge (where the Ethereum Proof of Work blockchain merged with a carbon copy called the Beacon Chain) had reduced its energy usage by 99.95%. From an annual usage of almost 85 TWh its energy usage is now negligible. This can only be seen as a good thing however the largest and most famous digital currency, Bitcoin has no plans to do something similar and still has an energy consumption of a staggering 127.15 TWh per year which is roughly comparable to the power consumption of the United Arab Emirates and similar to the carbon footprint of Greece. Furthermore, the “United States Data Center Energy Usage Report,” published in June 2016 and supported by the Federal Energy Management Program of the U.S. Department of Energy, found that based on current trend estimates, U.S. data centres were projected to consume approximately 73 TWh in 2020. To put that figure into perspective this is roughly equivalent to the total energy usage of a country like Chile and significantly greater than either Israel or Switzerland. IT clearly has a significant Carbon footprint and therefore must play a part in the overall solution.
It’s not surprising therefore that many companies are creating green initiatives to become more sustainable and reduce their carbon footprint, either through their own ethical practice or through action being forced on them by governments. The recent price rises in energy commodities — including oil, natural gas, and coal — due to the war in Ukraine and rebounds in demand for energy from a Covid-induced slowdown have only made these initiatives more urgent.
Orb Data is currently running a campaign to help companies accelerate their journey to carbon neutrality using IBM Turbonomic.
Click here for more details.
This blog will look at an IBM Turbonomic calculator to help companies estimate the carbon emissions associated with data centres and public cloud usage. This calculation can form a part of your project to ensure that your IT usage is as green and sustainable as it can be and is more importantly heading in the right direction.
The calculator discussed in this blog can be found here:

The calculator
The IBM Turbonmoic calculator is based on CloudCarbonFootprint.org however IBM has ensured that the user inputs for its calculator are information that a data centre or cloud administrator can reasonably be expected to know off the top of their head as opposed to using APIs. Additionally, the IBM calculator does not account for storage although we know there is a power element associated with this.
Sample Usage
Let’s walk through an example and look at the methodology it uses. Once you have clicked on the link above or typed in the URL https://www.turbonomic.com/sustainability-calculator/ (if you don’t like links) you will be greeted with a screen similar to the image below. This will ask you to choose the industry you are in. In my example, I have chosen Technology however other choices are
- Education
- Financial Services
- Government
- Healthcare
- Media and Entertainment
- Retail/E-commerce
- Service Provider
- And Other
Once you have chosen your industry press Start
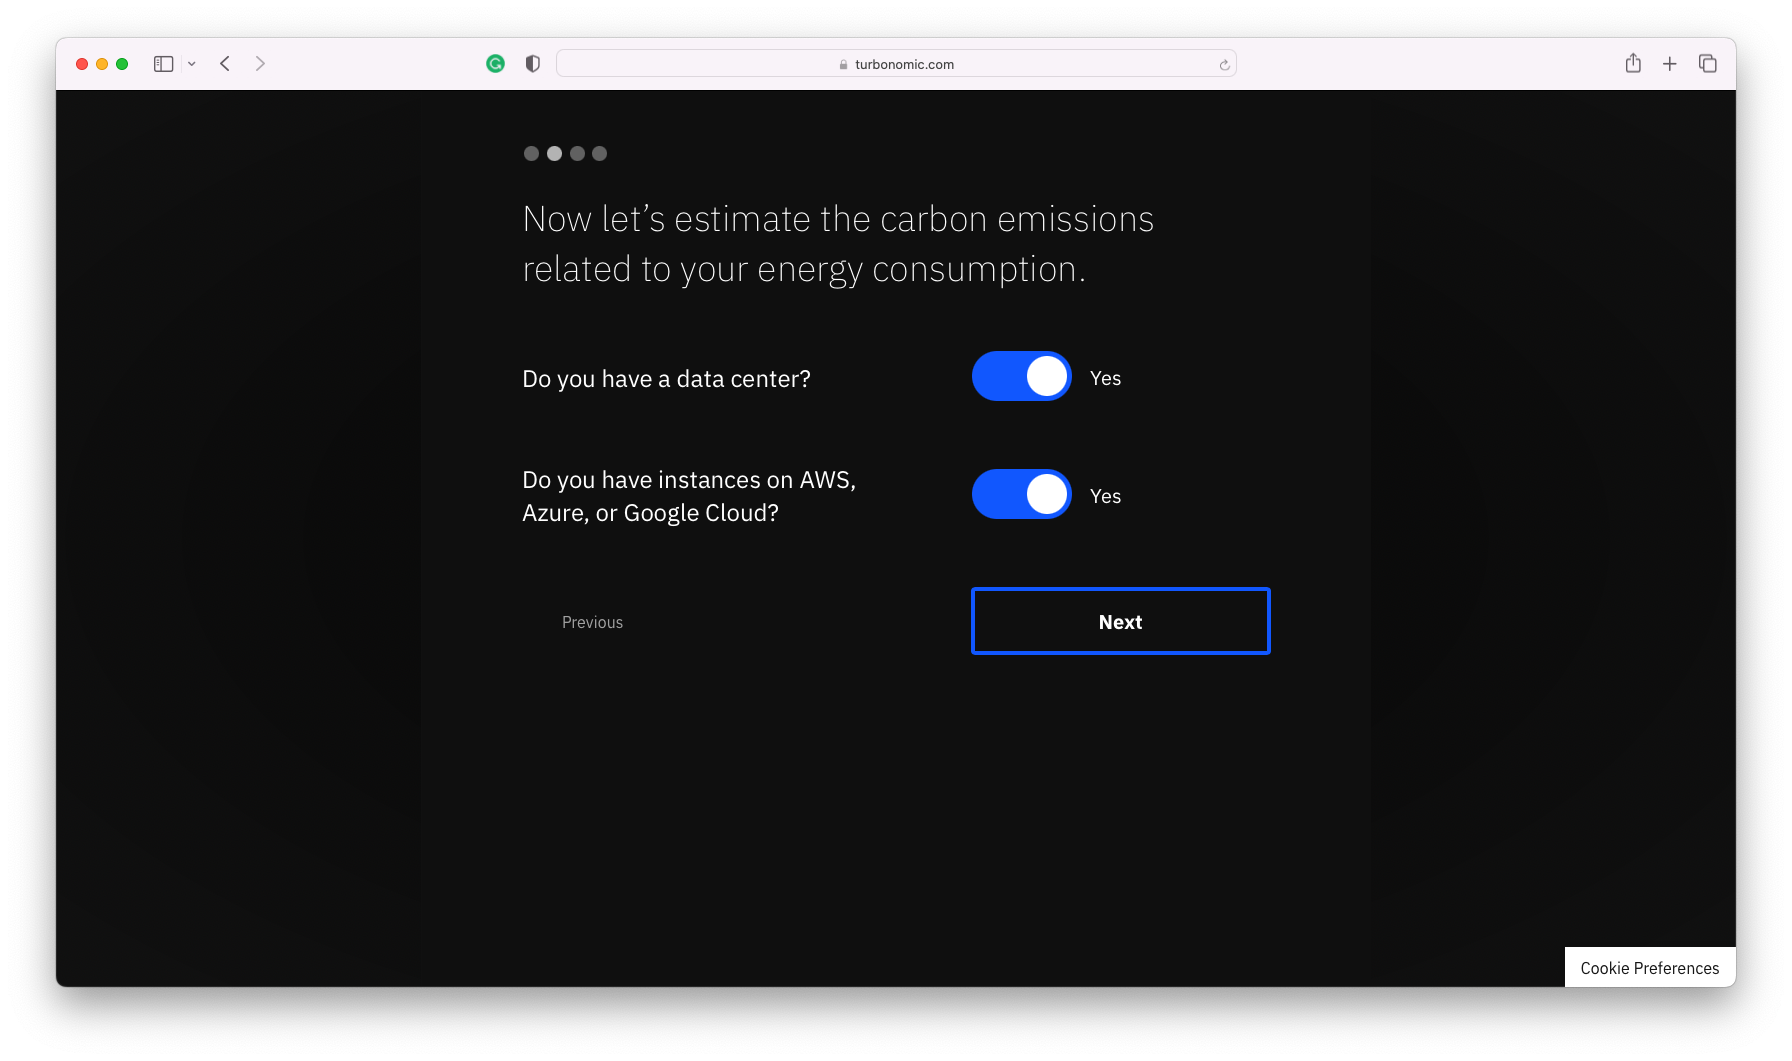
 The next page will ask if you have a data centre and/or instances in the 3 most common cloud providers (AWS, Azure or Google Cloud).
Choose the answers for your environment and press Next. In my case, I have chosen Yes for both.
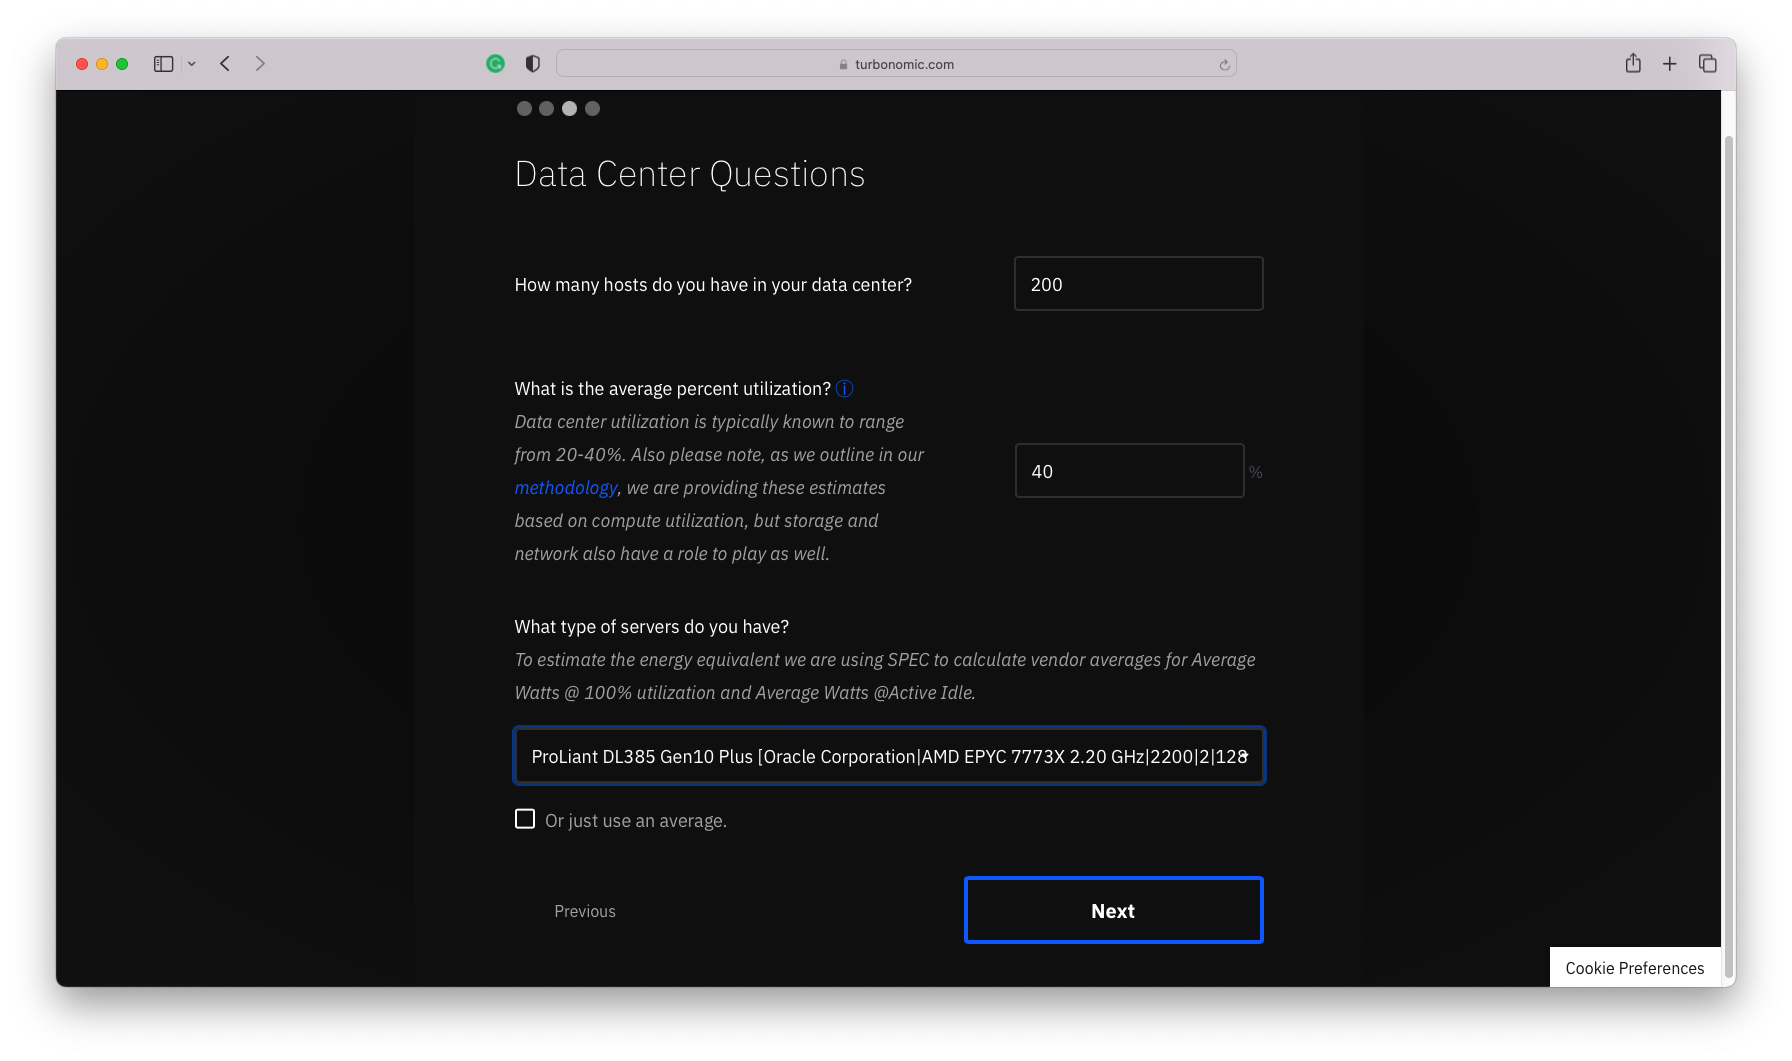
The third screen deals with Data Center questions.
How many hosts do you have in your own data centre? In my example, I have chosen 200.
Next, you are asked for the average percentage utilization. IBM Turbonomic suggests that research shows utilization rates anywhere between 20 and 40%. Note this refers to CPU utilisation and not storage.
Lastly, there is a large list of available systems you can choose from. If you have a mix or don’t know the type you have you can click on the Just use an average check box. The calculator gets the Min/Max Watts figures from this list: All Published SPECpower_ssj2008 Results
Press Next.
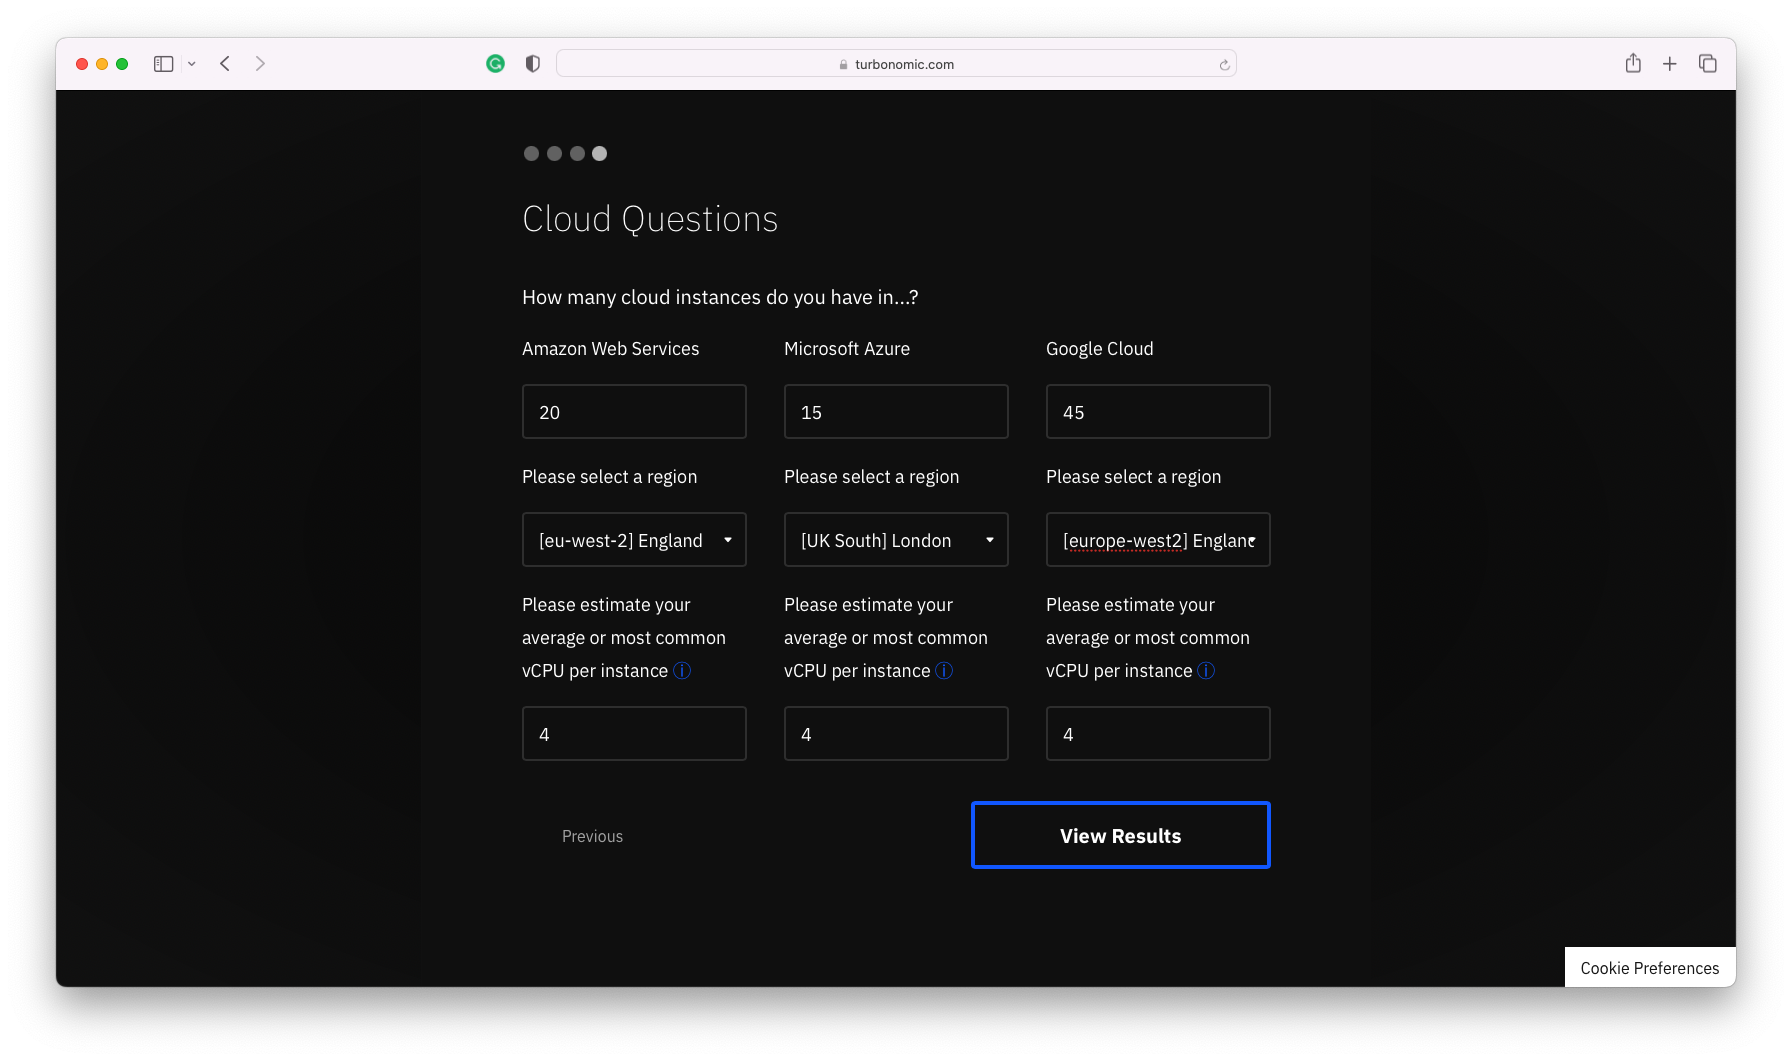
The last set of questions refers to your cloud usage and asks for the number of instances in each type of cloud provider, the region they are stored in and the average number of vCPUs on each instance. I have chosen the UK for all my instances and 4 for the number of vCPUs.
The location question is important as the carbon emissions related to your cloud workloads depend heavily on which region the workloads run in. IBM use the grid emission factors for AWS, Azure, and Google as provided by CloudCarbonFootprint.org here.
Press View Results.
The Results
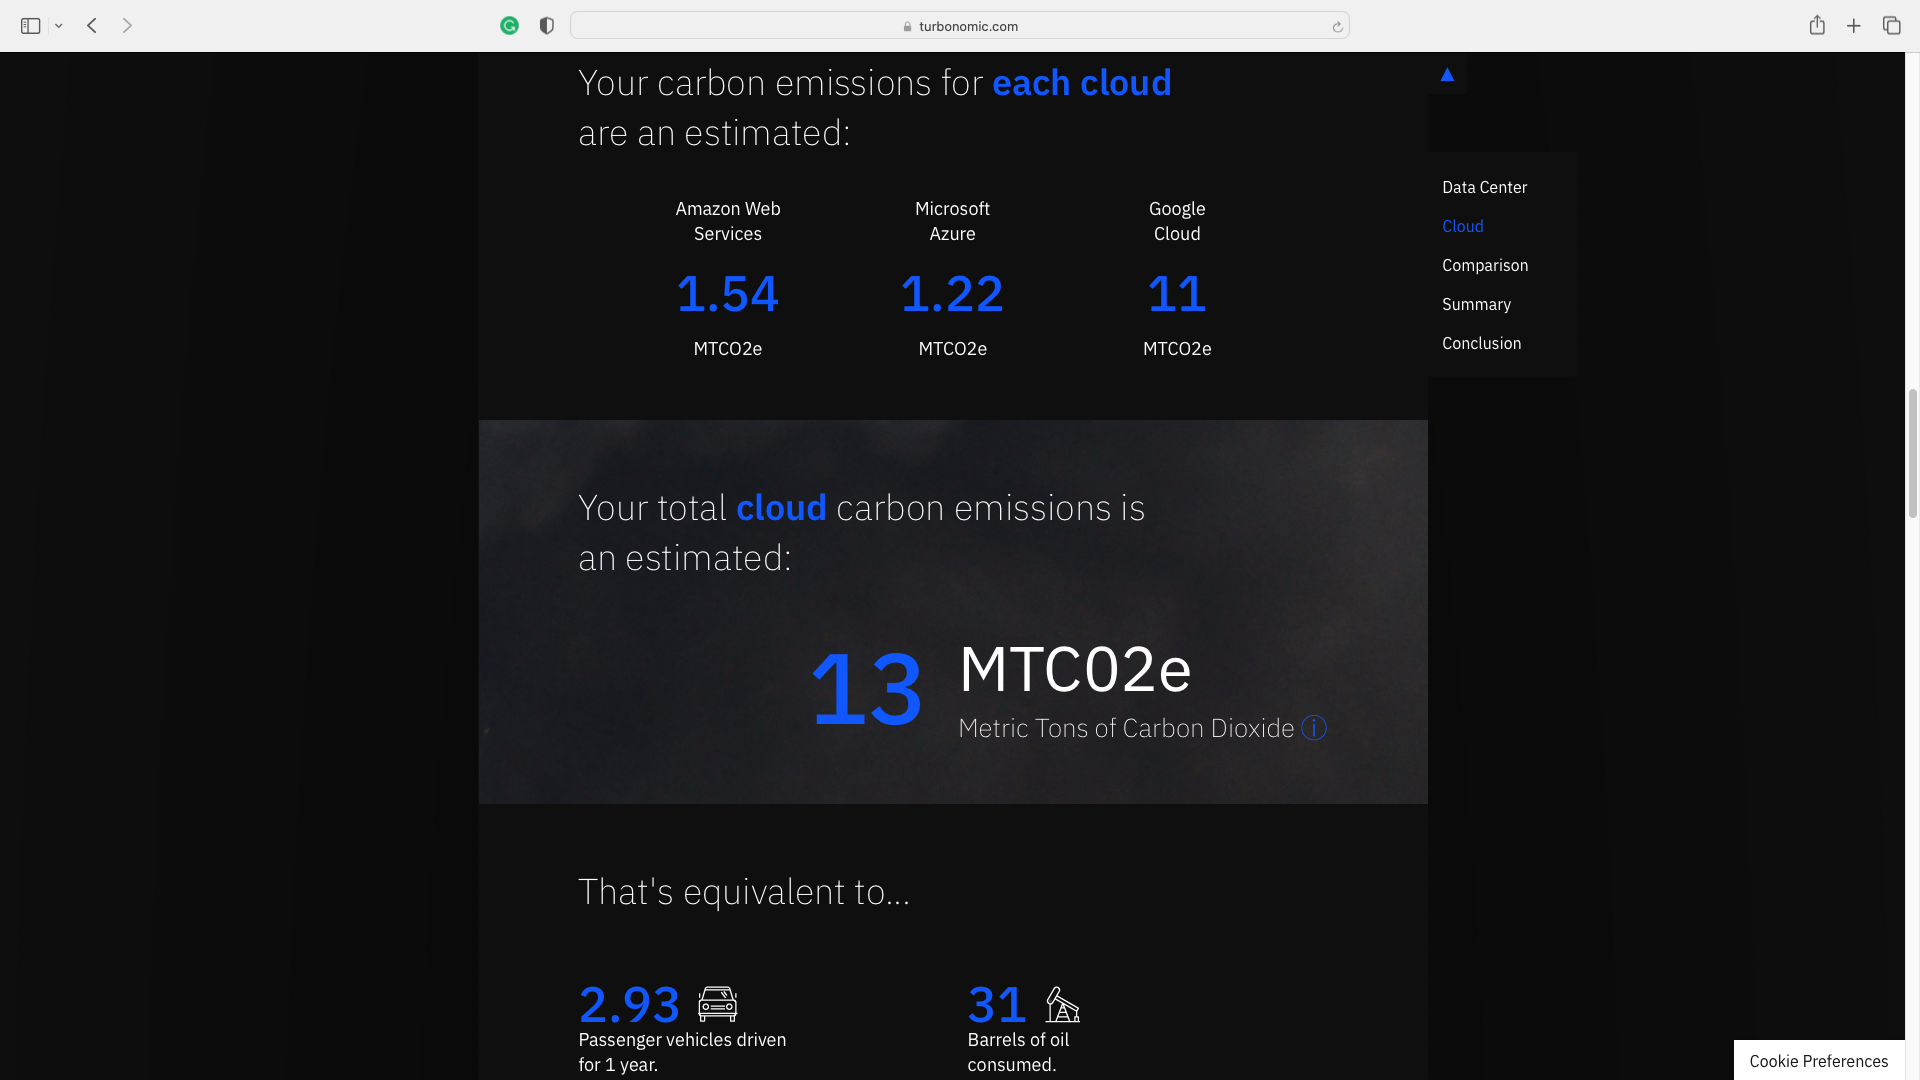
The Results screen displays your carbon emissions as Metric Tones of Carbon Dioxide (MTCO2e), in my case 580 MTCO2e.
In addition, it displays the total data centre power consumption in Kilowatt hours(kWh) we use annually. This was 818.7 kWh based on my results.
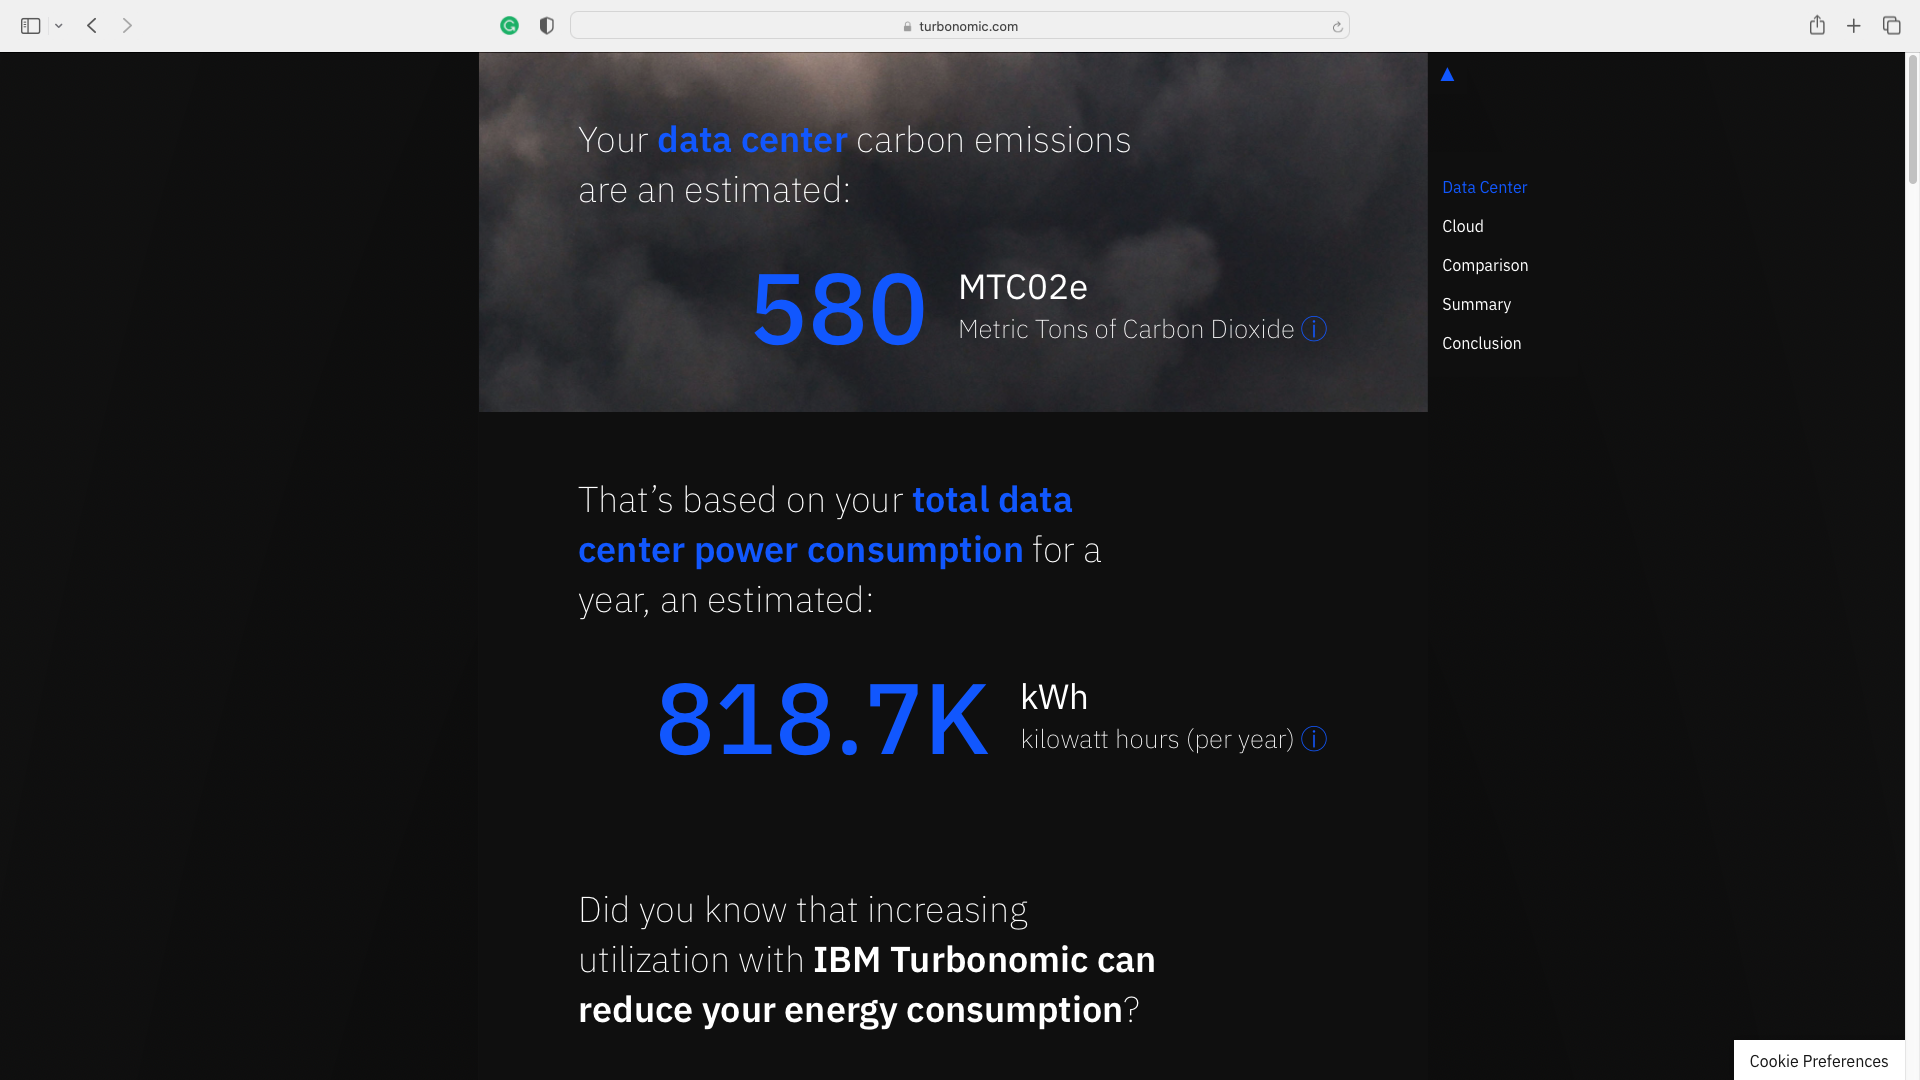
Below this, the carbon emissions are given for each cloud provider.
The Calculations
If you are interested in how these figures are worked out the calculations are detailed in this section. This information is taken from the excellent IBM Turbonmic blog
The results use 4 different calculations to estimate the carbon footprint (however the blog above shows more calculations to estimate equivalence):
Cloud
1/ Cloud Instances
Total Watt-Hours per Instance = (Average Watts) * (vCPU hours)
where…
Average Watts = Min Watts + Avg vCPU Utilization * (Max Watts – Min Watts)
AWS:
- Average Min Watts: 0.74
- Average Max Matts: 3.5
GCP:
- Median Min Watts: 0.71
- Median Max Watts: 4.26
Azure:
- Average Min Watts: 0.78
- Average Max Matts: 3.76
Source: https://www.cloudcarbonfootprint.org/docs/methodology/#energy-estimate-watt-hours
and…
vCPU hours = (vCPU/instance) * 8760 (hours per year)
Then multiply by the number of instances and convert to kilowatt hours (kWh).
Total Energy for All Cloud Instances (kWh) = (Total Watt-Hours per Instance * # instances) / 1000
Total energy consumption by Cloud provider
Total CSP Footprint Energy (kWh) = (Total Energy for CSP Instances) * (CSP Average PUE)
See CloudCarbonFootprint.org for cloud service providers’ average power usage effectiveness (PUE):
- AWS Average PUE: 1.135
- GCP Average PUE: 1.1
- Azure Average PUE: 1.125
2/ Total emissions by Cloud provider
CSP Emissions (metric tons CO2) = Total CSP Footprint Energy (kWh) * Cloud Region Grid Emission Factor CO2e (metric ton/kWh)
Total Cloud Emissions (metric tons CO2) = AWS Emissions (metric tons CO2) + GCP Emissions (metric tons CO2) + Azure Emissions (metric tons CO2)
Data Centre
3/ Physical Hosts
Total Energy for All Hosts (Watts) = # hosts * Average Energy / Host (Watts)
where…
Average Energy / Host (Watts) = Server Min Watts + Avg CPU Utilization * (Server Max Watts – Server Min Watts)
This uses the estimated average percent utilisation which is then converted into kilowatts.
Total Energy for All Hosts (kW) = Total Energy for All Hosts (Watts)/1000
This is then estimated as total energy (kWh) for a year.
Total Data Center Energy (kWh) in a Year = Total Energy for All Hosts (kW) * 8760 hours/year * Average PUE
An average power usage effectiveness (PUE) of 1.67 is used in our calculation.
4/ Total data centre footprint
Total Data Center Emissions (metric tons CO2) = Total Data Center Energy (kWh) / year * Emissions Factor
where the Emissions Factor is…
1,562.4 lbs CO2/MWh × (4.536 × 10^(-4) metric tons/lb) × 0.001 MWh/kWh = 7.09 × 10^(-4) metric tons CO2/kWh
OR
0.000709 (rounded)
IBM Turbonomic
Optimizing your data centre by running the same number of workloads on fewer hosts can make a difference in your energy bills and your carbon emissions and that is essentially what IBM Turbonomic does. Below the results section, the calculator allows you to see what difference a higher utilisation would make to your carbon footprint as shown below. In my case, a 70% utilization of my systems could reduce my carbon footprint by 15%. IBM think 80% is achievable.

If you want to read more about how IBM Turbonomic can make your IT usage more efficient and save you money at the same time read my previous blog Turbonomic: A performance tool that pays for itself
Views: 2406