
In the 1980’s there was a British TV show called Call My Bluff on which 2 teams of 3 “celebrities” battled to determine the correct definition of a given obscure word. The teams took turns to give three definitions, one true and two bluffs, while the other team attempted to determine which was correct. Recently software vendors have been playing this game with the word Observability and falling over themselves to define its meaning which unsurprisingly always seems to exactly match their own tools.

It’s not just me that has noticed this, in a recent Gartner report Innovation Insight for Observability, they stated:
“little consensus exists on the definition of observability and the benefits it provides, leading to confusion among I&O leaders purchasing tools”.
At Orb Data we always try to be helpful, and so in this blog we will play the celebrity that holds up the correct definition of the word observability. I will also talk about the differences between Monitoring and Observability and lastly suggest how your organisation should approach the adoption of these new tools.
What is Observability?
There is a standard dictionary definition which all vendors seem to use almost word for word.
Observability is defined as the ability of the internal states of a system to be determined by its external outputs.
However, what does this mean and why is it different to standard monitoring?
Generally, in monitoring systems you define what you want to monitor and choose your thresholds before you start, and you then build dashboards and create alerts to escalate known issues. The problem is that quite often incidents occur that have not been seen before and so you have no alert defined. In these circumstances the dashboards report no problems, and everything remains green. This phenomenon even has its own name: “watermelon dashboards.”
Observability is a deeper and more technical approach and requires full data instead of averages to explore the unknowns-unknowns. For this reason, observability platforms discover and collect performance data continuously by integrating with existing instrumentation built into application and infrastructure components. However, note that observability must be designed into an application so that tools can exploit it.
Observability can therefore be considered an evolution of monitoring, concentrating on the visibility of the state of the digital service by consuming data from the application whereas standard monitoring looks at individual components of the service. You could even consider monitoring as something you do to increase the observability of your system by collecting and displaying the data that makes a system observable. However, as I stated at the beginning of this blog software vendors differ in their definitions of what constitutes the implementation of observability in a monitoring tool. Observability must look at the full stack of data available otherwise you are just monitoring silos.
There are 3 main data types that are often called “the three pillars of observability” and are mentioned by most vendors of observability tools. These are:
- Logs: A log is a timestamped text record of an event. Logs can be used to create a high-fidelity, millisecond-by-millisecond record of the event. Logs are also typically the first place you look when something goes wrong in a system.
- Metrics: Metrics(sometimes called time series metrics) are measures of application and system health over a given period of time. These are things like CPU, run queue length, memory etc.
- Traces: A trace represents the end-to-end ‘journey’ of every user request, from the UI or mobile app through the entire distributed architecture and then back to the user. Every operation performed on the application are called “spans” and are encoded with important data relating to the microservice performing that operation.
Vendors often add to this list with their own strong points. For instance, IBM lists dependencies arguing that you need to know how each application component is dependent on other component whilst Dynatrace adds User Experience to the 3 pillars and AppDynamics lists Events. I’m sure each vendor would argue that they include all these items too and so I’ve included the links to the Vendor’s observability page so you can decide for yourself. As in all purchasing decisions it’s important to do your homework and ask the right questions.
One of these questions should be “Do you support OpenTelemetry”?
OpenTelemetry is an emerging open standard which was formed in 2019 with the goal of simplifying the telemetry ecosystem by providing a unified set of instrumentation libraries and specifications for observability telemetry. As a vendor-agnostic service, OpenTelemetry is compatible with a growing list of leading OSS and commercial backends, including Jaeger and Zipkin. Gartner in their previously mentioned paper said select “vendors and systems that utilize emerging open standards for collection, such as OpenTelemetry and OpenMetrics”. For instance, in the IBM Instana tool this is enabled by default.
However, for the best observability experience you need to go further and collect data from anything that helps to explain the state of the application or service. This could include data like Social sentiment where users can often give you a quicker view when something is wrong than any monitoring tool. You should also consider looking at Business Context and Business Data so that you can contextualise IT performance with real-time business data. This will help you to connect full-stack observability with real-time business outcomes.
Linda Tong, vice president and general manager of Cisco AppDynamics, said,
“Technologists have recognized that without business context, they will quickly find themselves drowning in complexity and data noise.“
Gartner agree and have created this diagram which has 10 inputs rather than the 3 we mentioned earlier.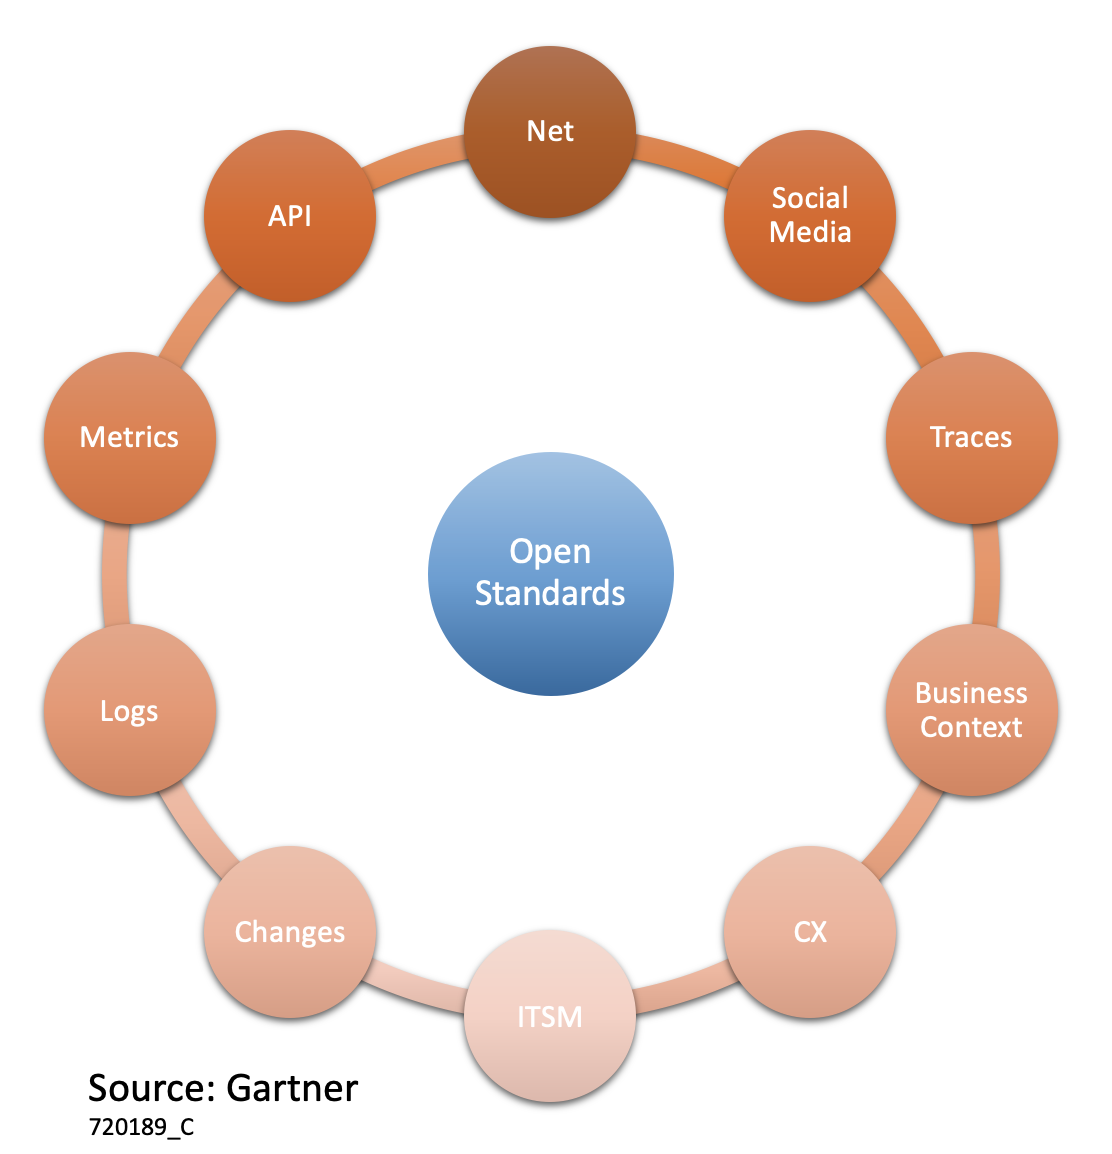
Making Sense of the Data
Collecting and storing data is only one part of the observability tool’s function. I’ve broken the remaining functionality into four components that are involved in implementing observability:
Correlation
The key for observability tools is to identify an important anomaly from potentially millions of other anomalies, and then link that issue to other pertinent data from log files, traces or metrics. For instance, Instana is able to collect, process, analyse and provide results in the user interface in one second intervals. By showing correlated information in the context of the anomaly detected, the user can quickly isolate the potential root cause of problems.
Topology
I already stated that IBM include Dependencies in their list of required data, and I would agree that topology information is essential to understand the relationships between interdependent components in a highly dynamic, multi-cloud environment. Alongside this is continuous automatic discovery of the components of an application and baselining of all the data on a continuous basis. Instana and Dynatrace both have agents that sense what is running in the container or the JVM and automatically injects the correct instrumentation.
AIOps
Perhaps the most important aspect of observability systems is the use of AI to aggregate, correlate and prioritise incident data, allowing you to detect issues and accelerate incident response. Due to the sheer amount of data collected by observability tools, many platforms include AIOps (artificial intelligence for operations) capabilities that find the signals (indications of real problems) from the noise (data unrelated to issues). The causation-based AI should automatically detect any unusual changes to discover the previously mentioned unknown-unknowns that could not be monitored manually.
Incident Response
Lastly the tools should allow for automated remediation using machine learning to resolve them without manual intervention. This is generally more granular than in a standard monitoring system. For example, Instana has three event types:
- Change: An event that indicates an environment change, for example, a configuration change, server start/stop or deployment.
- Issue: An event that indicates an unhealthy state for a service, application or infrastructure component, for example an incorrect number of Kubernetes replica sets, a rapid drop of calls to a service or a high system load.
- Incident: An incident indicates the breach of a KPI on an edge service or a critical infrastructure issue. An Incident indicates that user experience or service is, or will very shortly, be degraded. Related issues and changes are correlated to the incident to provide context and aid root cause analysis.
From these we can define an Alert which can forward incidents, issues or changes via an “Alert Channel” to an external application which may just notify someone or trigger an automated response.
To read more about how this works with Instana you can this read this blog by my colleague Nick Lansdowne.
From Monitoring to Observability
There is a risk that when you start looking at observability tools that software vendors, who are promising observability, have just rebranded their existing monitoring tools without any thought to the observability functionality I have described here. Therefore, to judge each provider you should score the vendors on the following points:
- The ability to collect the three pillars of observability: Metrics, Traces and Logs
- Utilisation of emerging open standards for collection, such as OpenTelemetry and OpenMetrics
- Usage of AI to aggregate, correlate and prioritize incident data
- Understanding of the relationships between interdependent components and an automated discovery of components on a system
- Automated remediation of incidents using machine learning to resolve them without management intervention
“Observability is an evolution, not a revolution”, Gartner
APM Experts have already analysed all the Observability systems using similar capability suggestions to myself. Their results are shown below but the detailed analysis can be read here: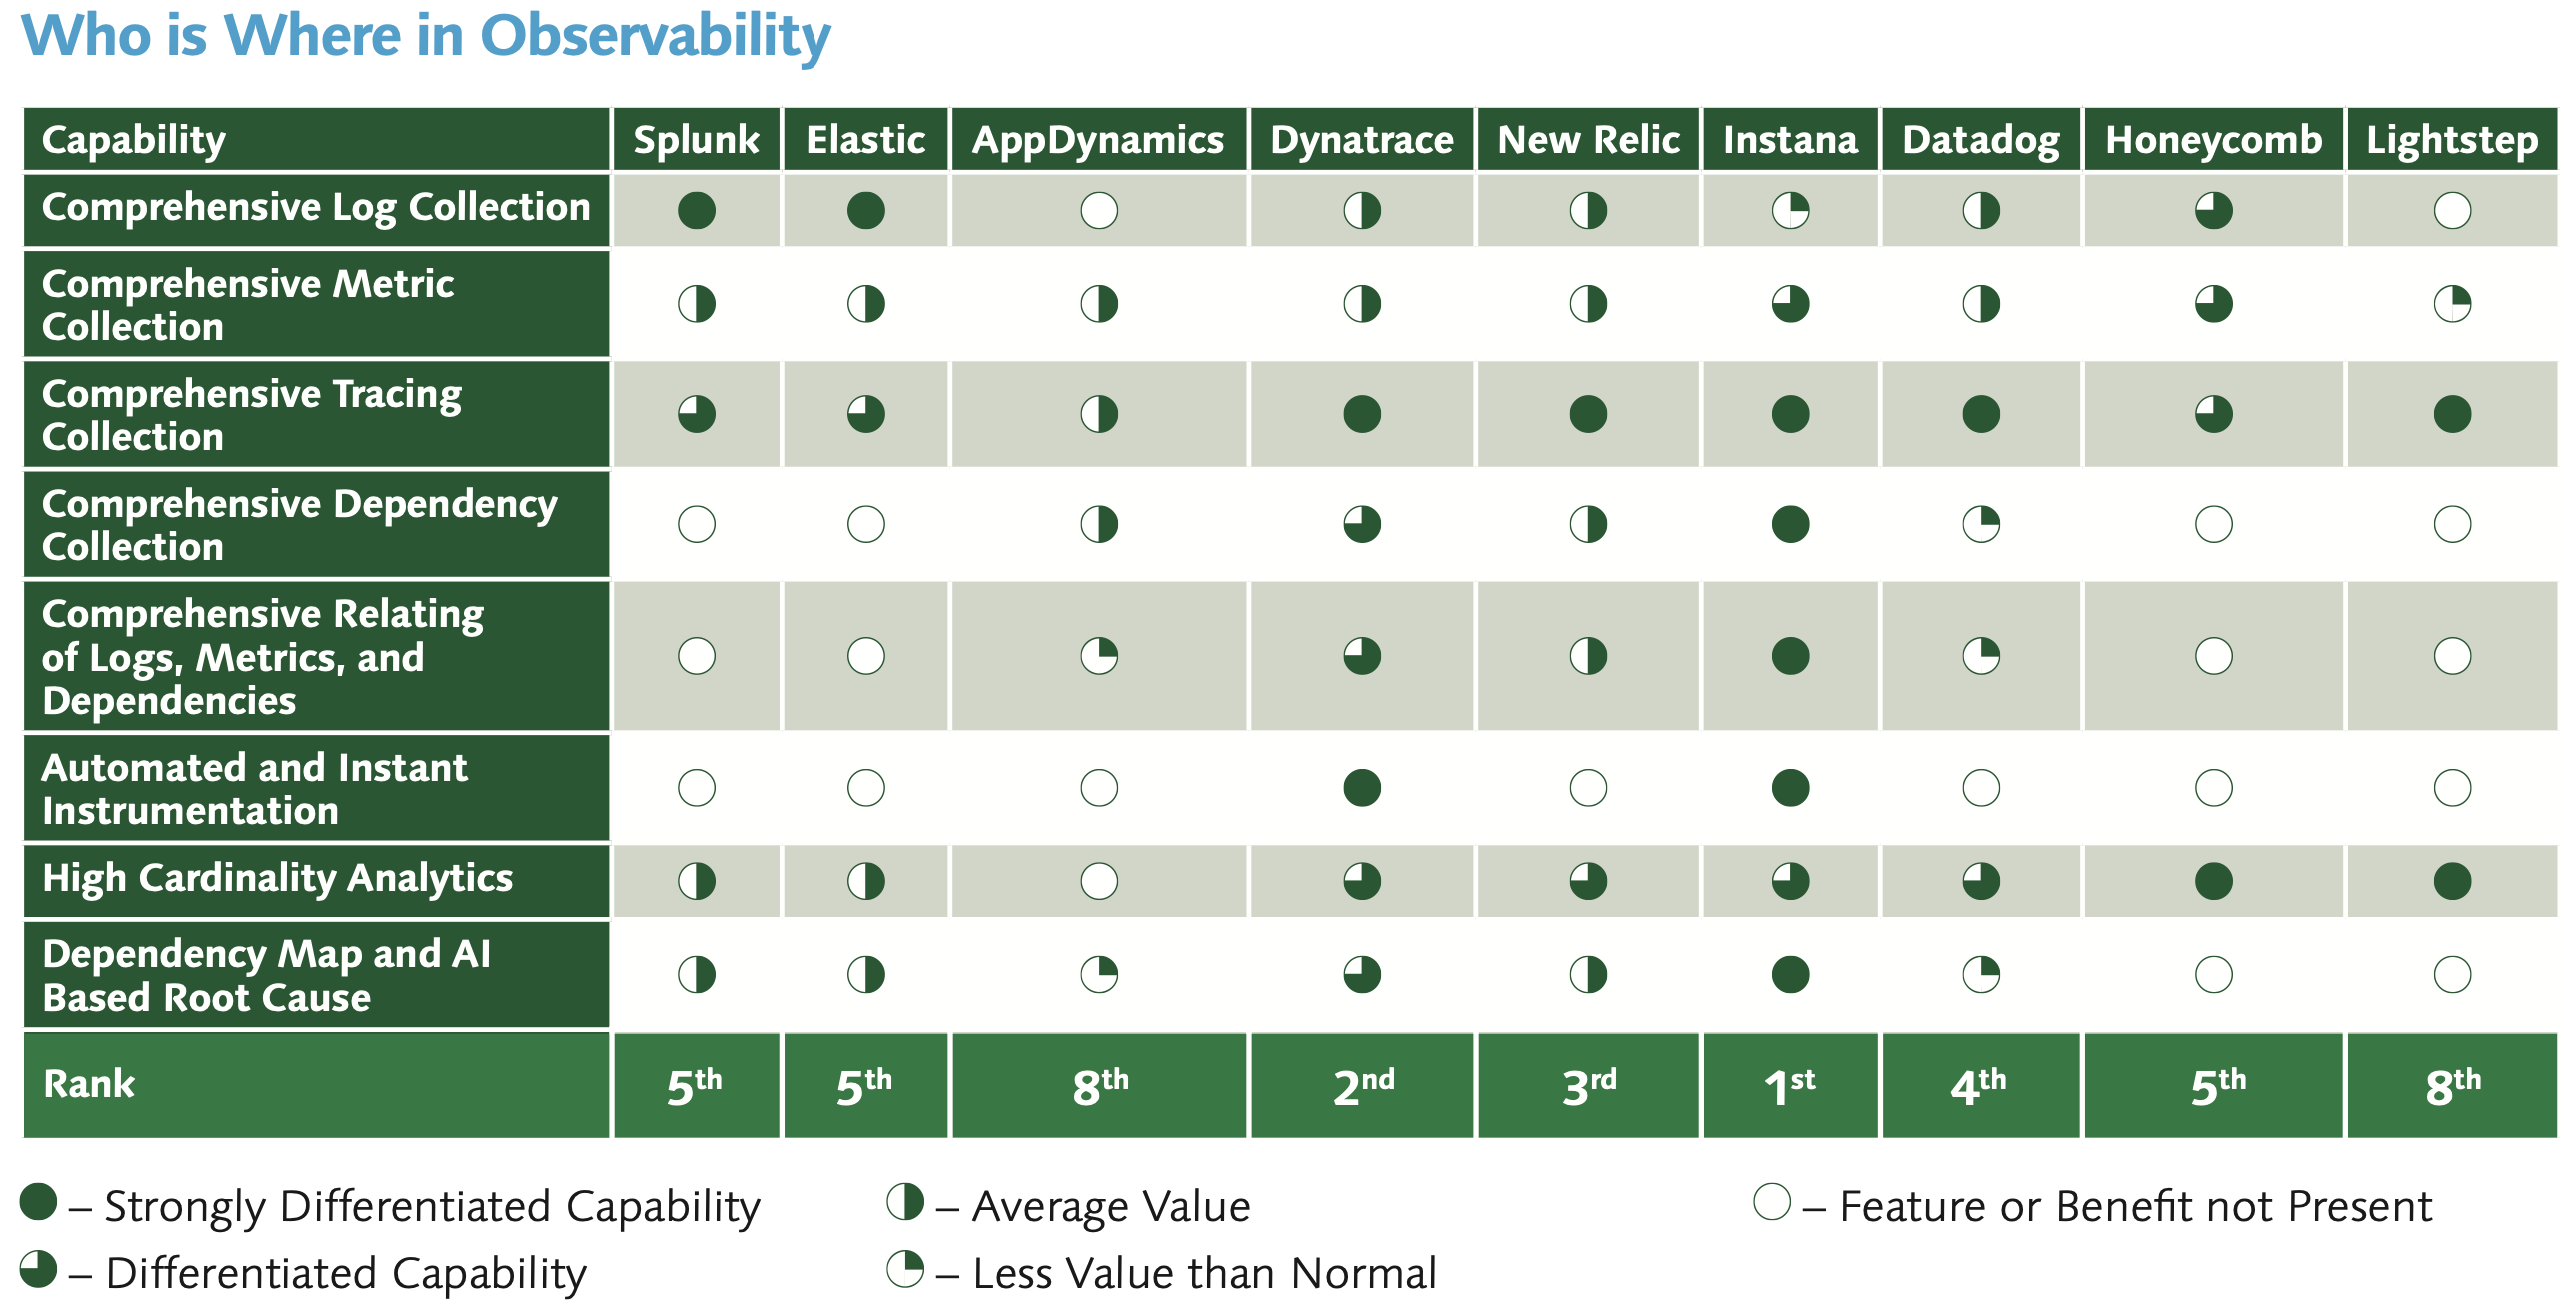
A big bang approach where you remove all of your current tools and buy a new observability platform is not the right method and depending on the nature of your current estate many of your legacy applications may not be suitable for the observability approach. Instead, observability tools should be aimed at the increasingly rapid, distributed and dynamic cloud-native application deployments. These changing environments are more likely to be using DevOps practices which will make an automated data collection for observability a much better solution. It is also more likely that the developers can include the correct outputs in their software so that it can be made fully observable.
Lastly I’m sure you’ve already looked up the word Nesselrode (shown in the first image) but for those that haven’t it means “a mixture of preserved fruits, nuts, etc., used as a sauce or in pies, puddings, ice cream, or the like” however I’m sure you already knew that.
If you would like to know more about observability, Instana, AIOps or even Call my Bluff then please email me at simon.barnes@orb-data.com or comment below.
Views: 674