
I’ve been working with IBM’s Monitoring and Event Management products for about 25 years and in that time, there have been 3 big events that significantly changed the products that we deployed. Firstly, there was the introduction of the Tivoli Enterprise Console (TEC) into the portfolio in 1996 that introduced the concept of rules such as correlation and deduplication. Then in 2004 IBM bought Candle and converted Omegamon into the new IBM Tivoli Monitoring version 6, replacing IBM Tivoli Monitoring v5 (read my separate blog on IBM’s naming from 2011) and at the same time discarded the Tivoli Framework. Then lastly IBM bought Micromuse in 2005 and replaced the TEC and Netview with the Netcool suite of tools. Now we can add a fourth event to that list. On 29th December 2020 IBM announced the purchase of Instana which clearly is intended to be IBM’s new monitoring product of choice and feed data and alerts into their newly branded Watson AIOps suite of products.
| Year | Product Purchased | Products Replaced |
| 1995 | Tivoli Enterprise Console (TEC) | None |
| 2004 | Candle Omegamon (renamed to IBM Tivoli Monitoring v6) | IBM Tivoli Monitoring v5 (formerly Tivoli Sentry) and the Tivoli Framework |
| 2005 | Micromuse Netcool | TEC and Netview |
| 2020 | Instana | IBM Monitoring and its variants.
ITCAM for * Smart Cloud Monitoring, Smart Cloud Application Performance Monitoring IBM Cloud Application Performance Monitoring CP4MCM Monitoring |
In those 25 years event management has changed a lot: We have moved from agent-based monitoring of simple Unix and Windows metrics (and yes occasionally mainframes too) to Kubernetes becoming the management and deployment layer for modern applications and (hybrid) cloud environments. At the same time, we’ve also seen a rapid shift to DevOps and a faster and more frequent cycle of application deployment. At the same time applications have become so large and complex that it’s become almost impossible to monitor them using conventional tools and human interaction.
“And at our scale, humans cannot continuously monitor the status of all of our systems” – Netflix
IBM have been changing their own tools to manage these changes but Instana has been designed specifically for the challenges of managing microservice and cloud-native applications and this is clearly the reason why IBM made the purchase. This blog will look at what exactly IBM have purchased and where this will fit into the product portfolio.
What is Instana?
Since the announcement I’ve been taking a look at Instana’s features. These are the 6 Core Capabilities:
- Automated Discovery & Monitoring
- Context Guide
- Application Perspectives
- Pipeline Feedback
- Root Cause Analysis
- Unbounded Analytics
Automated Discovery & Monitoring
Instana uses an agent and sensor architecture. Sensors are mini agents designed to attach and monitor one thing which are managed by a single agent (one per host), which is deployed either as a stand-alone process on the host, or as a container via the container scheduler. The agents automatically detect the physical components like AWS zones, Docker containers running on the host or Kubernetes, and processes or clusters of processes (e.g. a Cassandra cluster). Discovery is recursive within a sensor so for example, the Java Machine sensor continues up the stack and discovers frameworks running on it (like Tomcat or SpringBoot), then assists the agent to load the appropriate additional sensors. The agent is lightweight and can be injected into thousands of hosts.
For each component it detects, the agent will collect its configuration data and start monitoring it for changes. It also starts sending important metrics for each component every second. The agent manages all communication to the Instana Service Quality Engine. After discovery, the sensor collectsF the following:
- Configuration – the current settings and state in order to keep track of any change
- Events – Initial discovery, all state changes (online and offline), built-in events that trigger issues or incidents based on failing health rules on entities, and custom events that trigger issues or incidents based on the thresholds of an individual metric of any given entity
- Traces – Traces are captured based upon the programming language platform
- Metrics – Qualitative attributes of the technology that indicate performance
The intelligence combining this data into traces, discovering dependencies and services, and detecting changes and issues is done on the server. The Instana backend utilizes streaming technology able to process millions of events per second streamed from the agents. The streaming engine will take only 3 seconds to process an issue and display it to the user.
Context Guide
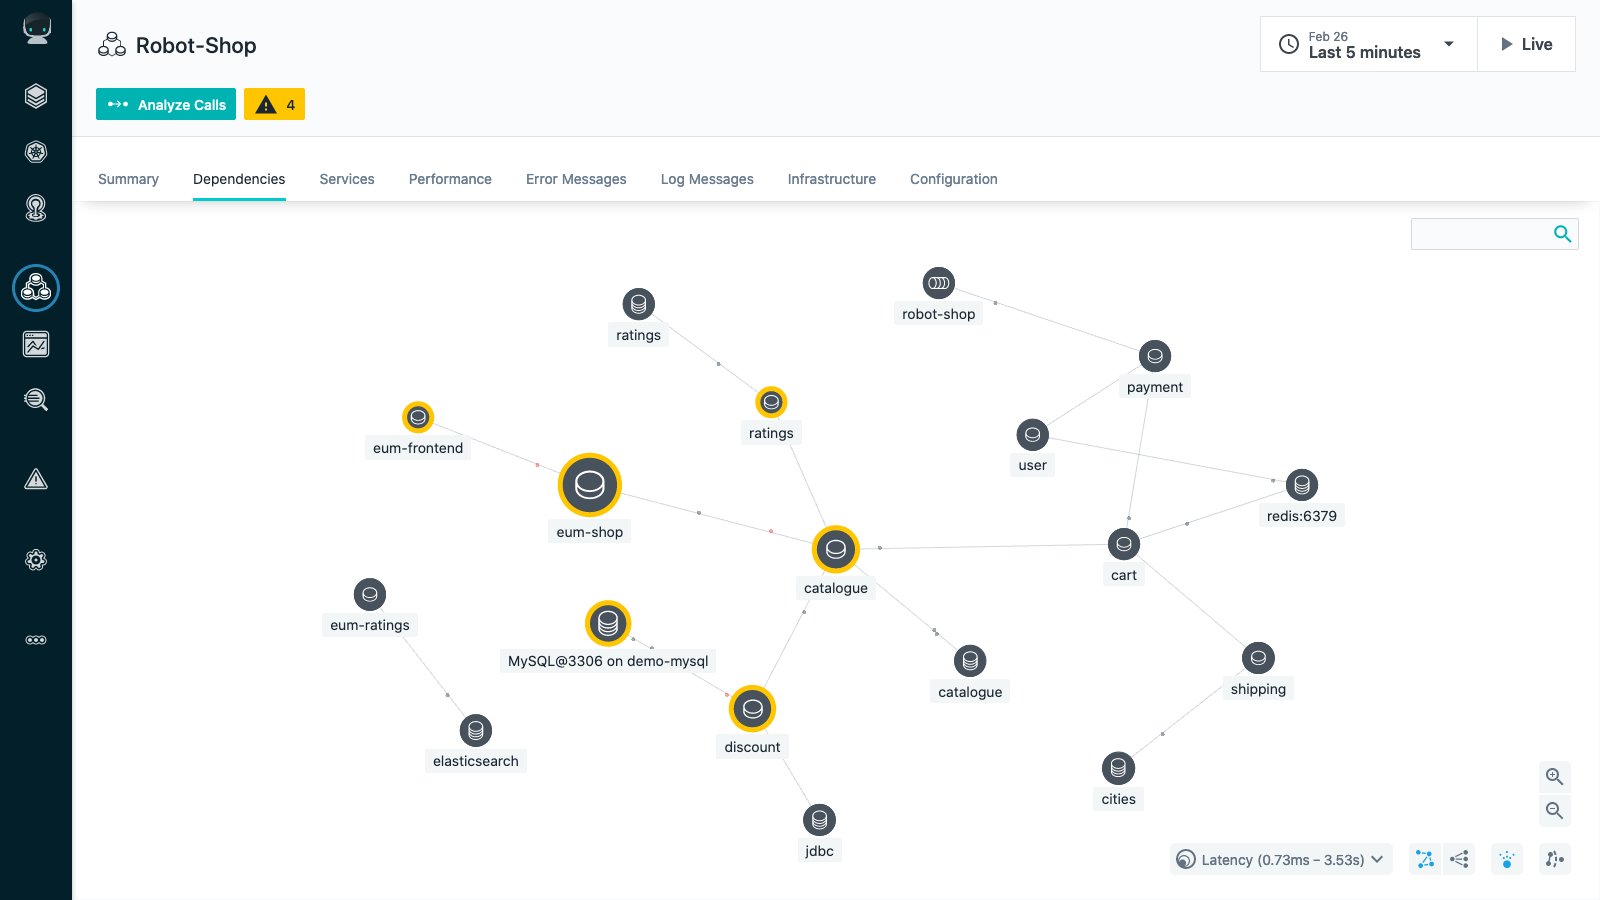
The Context Guide is a visual representation of Application Perspective services and related underlying infrastructure. This uses Instana’s Dynamic Graph which tracks physical infrastructure components and associates them with their logical counterparts. The dynamic graph is a model of an application that understands all the physical and logical dependencies of components such as Host, OS, JVM, Cassandra Node, MySQL, etc. The graph also includes logical components such as traces, applications, services, clusters, and tablespaces. As already stated these components and dependencies are automatically discovered by the agent and sensors in real-time. Every node in the graph is also continuously updated with state information like metrics, configuration data, and a calculated health value based on semantical knowledge and a machine learning approach.
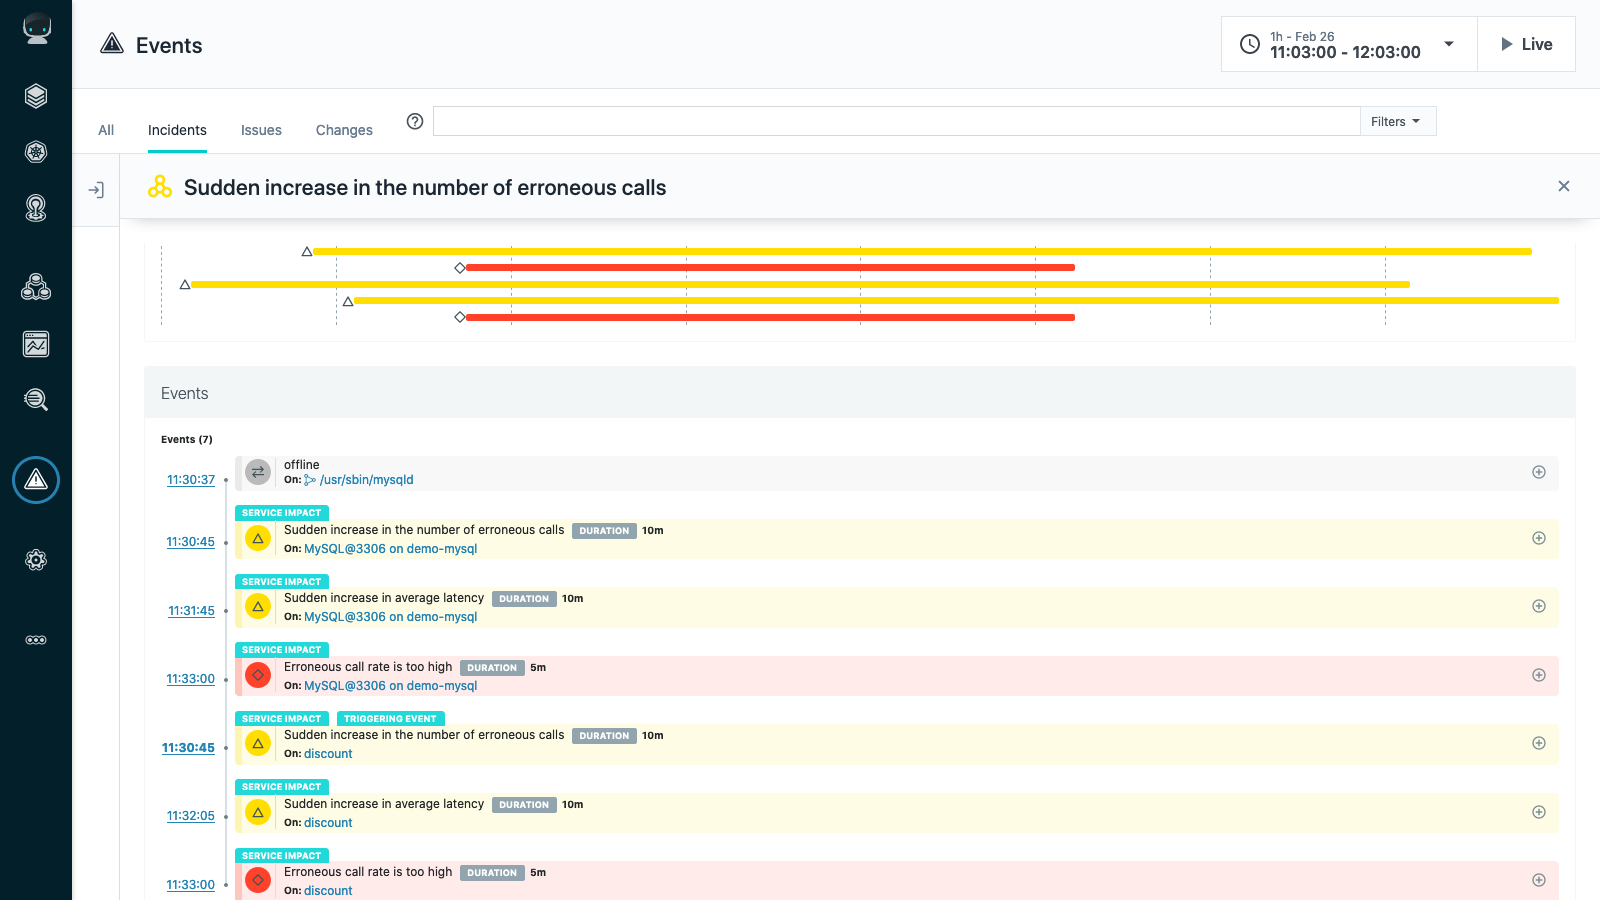
Based on the Dynamic Graph, the impact of changes and issues are calculated and if the impact is critical a set of correlated issues and changes are created as an Incident. An incident shows how issues and changes evolve over time, enabling Instana to point directly to the root cause of the incident. A change can be a degradation of health (an “Issue”), a configuration change, a deployment or appearance/disappearance of a process, container or server.
Application Perspectives
Application perspectives enables the application view to represent a set of services and endpoints that are defined by a shared context and is declared using tags. For example, you can capture multi-tenants, different Kubernetes’s environments or different applications or services in a view.
Pipeline Feedback
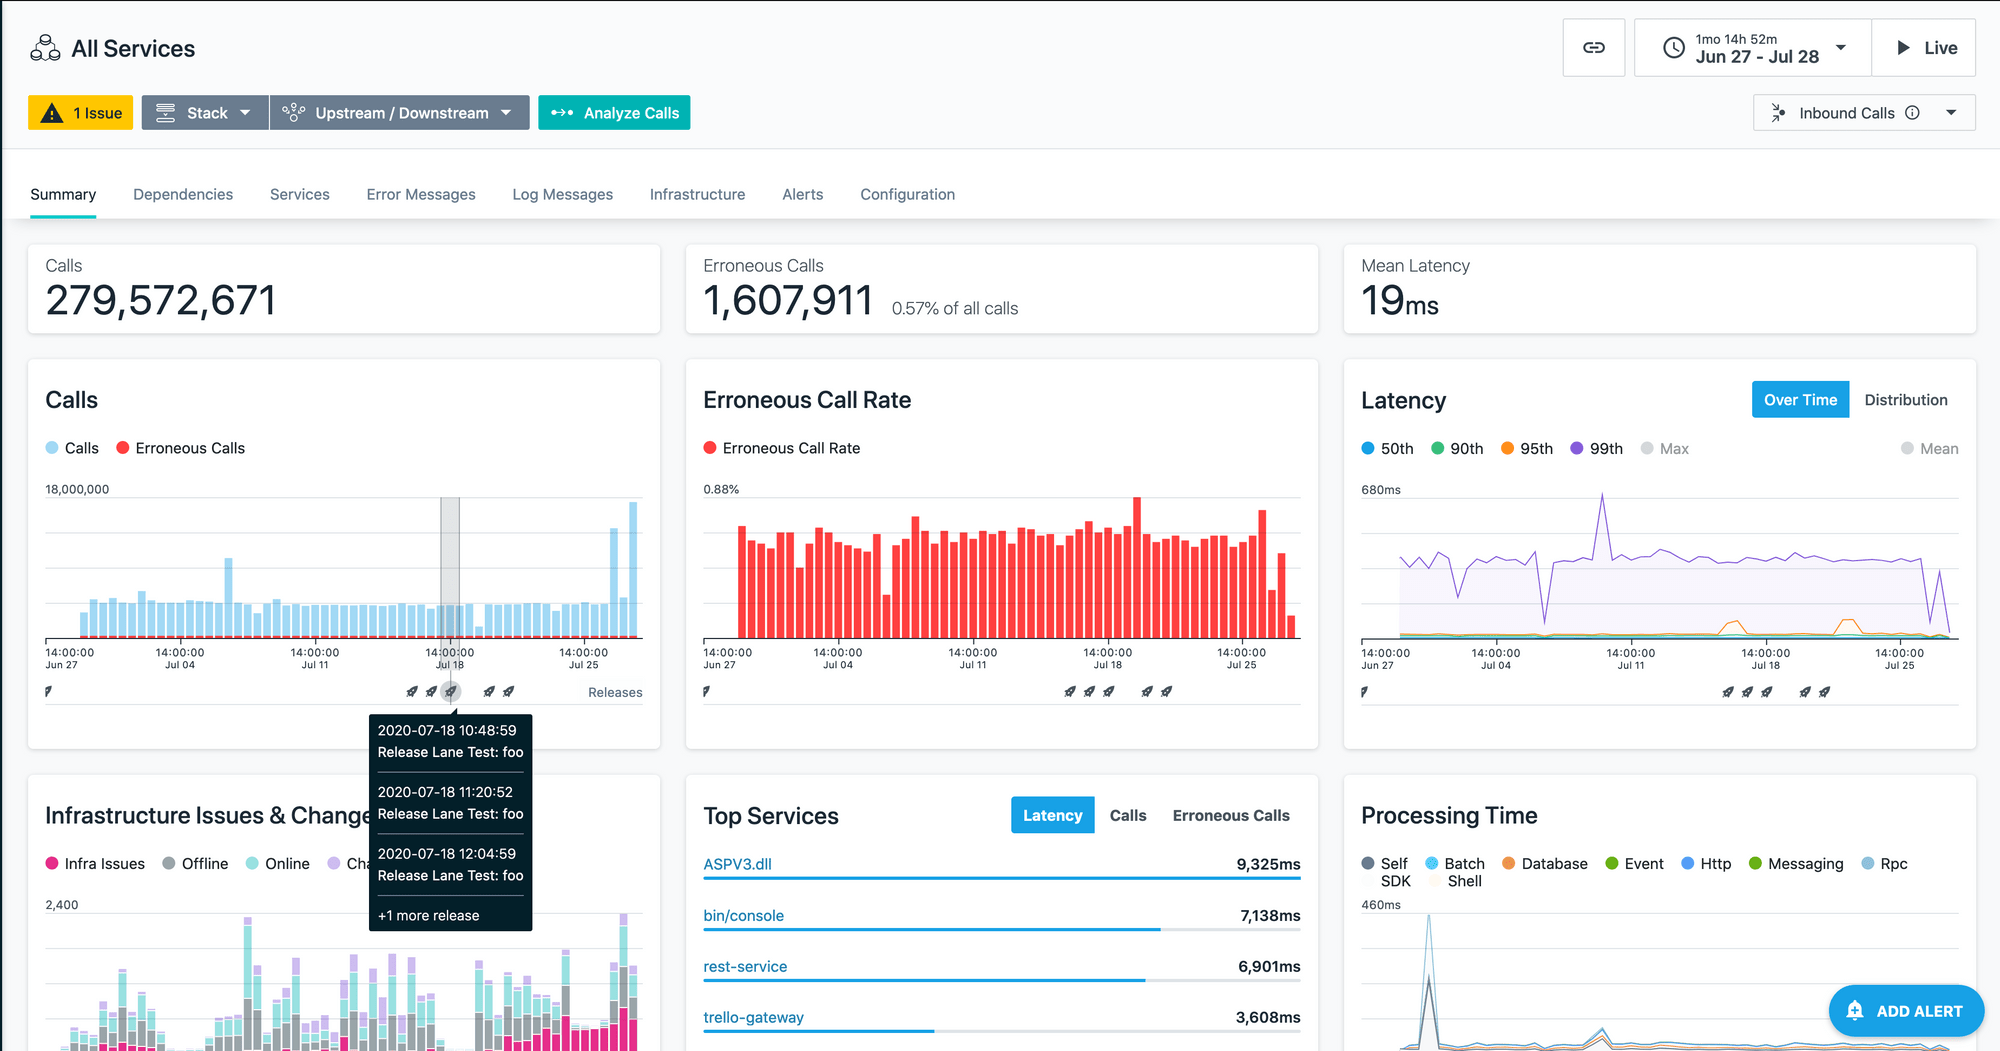
Instana Pipeline Feedback is an automatic analysis of application development and deployment pipeline events, correlated directly with application, infrastructure, and service performance data. For example, when a new release is deployed, if there is a latency spike it may indicate that the release led to a degradation in performance, which helps to decide on whether to roll back to a previous version or identify a specific problem to be resolved.
Root Cause Analysis
Instana has made significant strides in managing incidents and accelerating the identification of root cause. Instana automatically detects the following 3 actions:
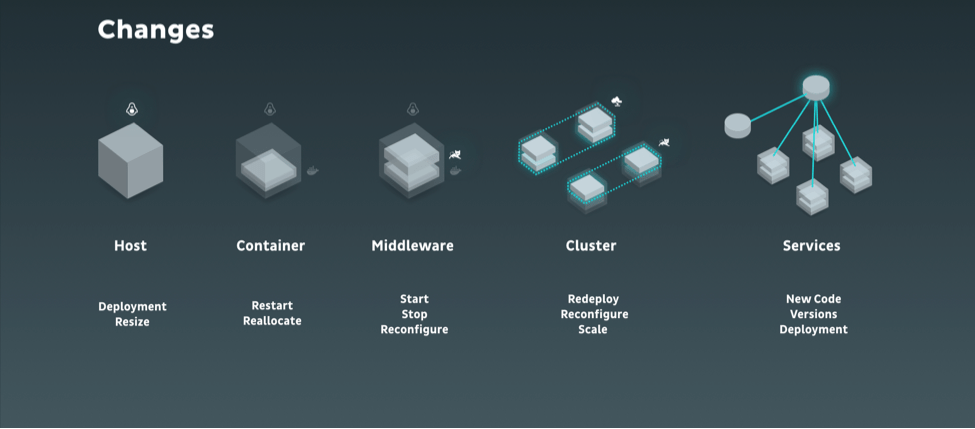
- Changes – A Change is an event representing anything from a server restart to a configuration change. Change events are used together with the Dynamic Graph to automatically detect the relation of changes in configuration to incidents.
- Issues – An Issue is an event that gets created if an application, service or any part of it breaks. Instana is provided with several hundreds of out-of-the-box curated health signatures detecting various problems ranging from degradations of service quality, to complex infrastructure issues, to disk saturation. Issues are automatically resolved as soon as the metrics, events or metadata returns to the expected values. You can also define custom events to detect problems which are specific to your system.
- Incidents – Incidents yield the highest severity level. They are created when edge services accessed by end-users are impacted or there is an imminent risk of impact. Using Dynamic Graph all relevant events are correlated for each incident to provide context and root cause analysis hypotheses.
Unbounded Analytics
The Unbounded Analytics feature provides the ability to generate new insights from all unsampled, high-cardinality data. This capability uses tag-based filtering, grouping, and visualization. All data sources and tags can be used by the tag-based query builder.
4 FAQs about Instana
01
Does it have Agents?
Yes – there are several agents split into types: 1/ 3rd party platform such as EC2, Azure, IBM Cloud. 2/ Self-Managed Platform such as Kubernetes, VMware, Docker etc. 3/ Operating System such as Linux, Windows, Unix and Mac OS. 4/There are also agents for Website monitoring and Mobile Application Monitoring.
02
Can it forward events to 3rd party tools?
Yes there are built in integrations to tools such as Microsoft Teams, OpsGenie, Slack, PagerDuty, Splunk and more generic tools like email and Webhooks. Netcool will obviously follow but this could be performed today with the Webhook integration.
03
Where does it store data?
Data is stored in multiple places. For example, Cassandra stores Metrics history, spans and profiles whereas cockroachDB stores the user settings store and historic usage statistics.
04
Does it allow integrations?
Instana is built to be open and extensible and has integrations into REST, Grafana, DBmarlin and several more.
Where does Instana fit in to the IBM product Portfolio?
The IBM event management portfolio has changed quite a lot recently with many of the existing products being moved under the Watson AIOps brand. The diagram below shows the previous names and the new names in the Watson AIOps 2.0 portfolio.

As you can see, existing products like Netcool Operations Insight (NOI) and Predictive Insights are still important components in IBM’s portfolio, and are integrated alongside AI Manager to create the new Watson AIOps platform (albeit with new names), but the question is where does Instana fit into this?
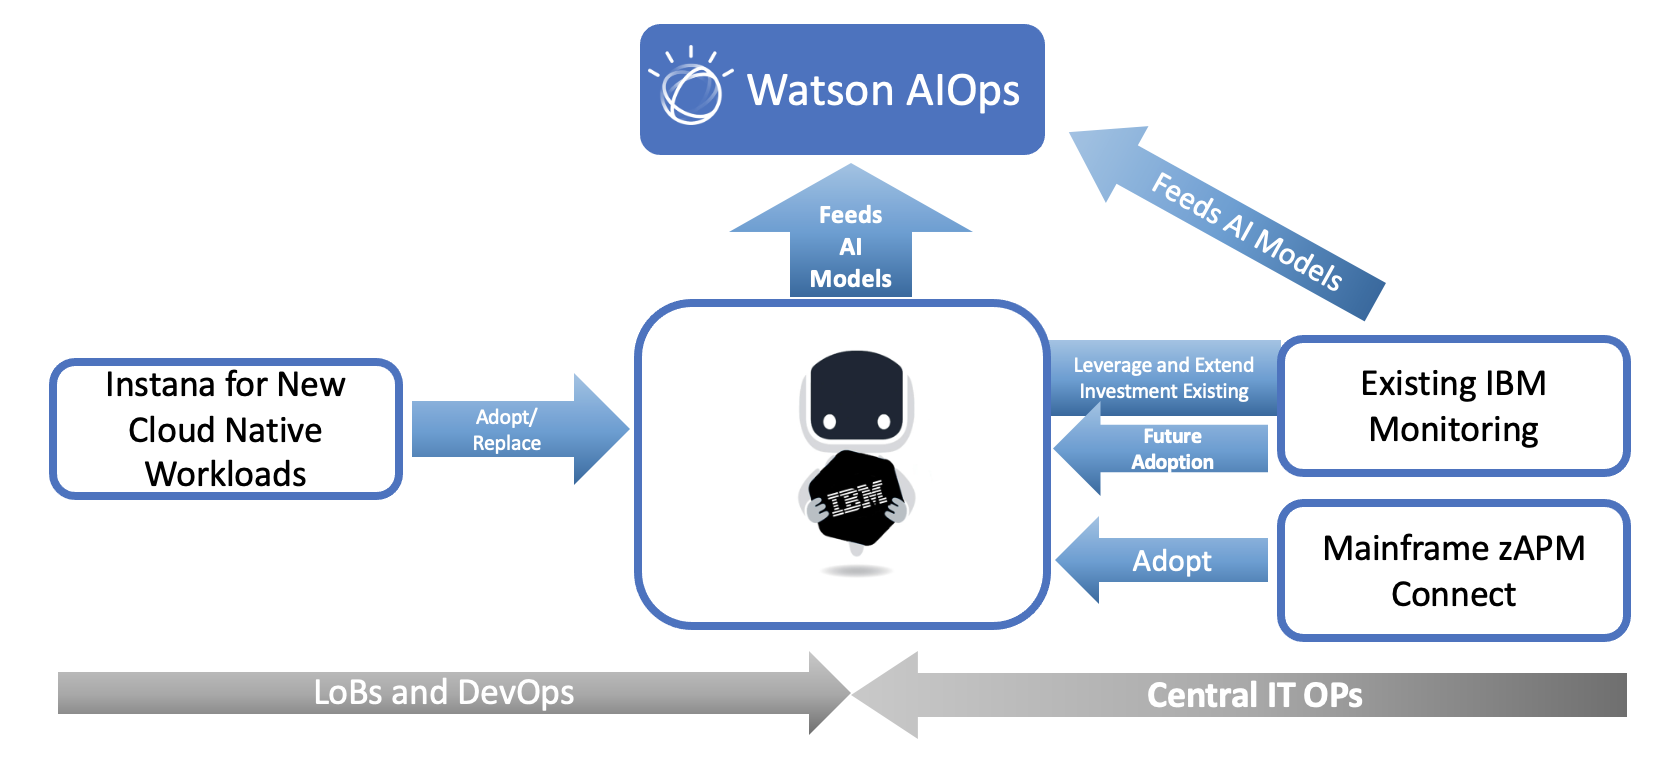
In a presentation shortly after the Instana acquisition IBM presented the following slide. It’s clear from this that they see Instana as their prime monitoring tool and IBM expect all future monitoring they sell will be performed by Instana whilst in parallel maintaining the existing monitoring tools for current customers. This is a very similar approach taken to that after the Candle acquisition and IBM at that time created a v5 monitoring agent to allow existing customers to migrate to the new v6 platform using their existing agents. This may very well happen again this time. Lastly from this slide you can see IBM expect all of these tools will feed into Watson AIOps.
Clearly there will be some gaps in Instana’s agents and sensors around the IBM tooling that IBM’s existing customers rely on. Products such as WebSphere and WebSphere MQ don’t have current agents (although they are detected) however IBM have already mentioned that these will be added into Instana’s monitoring shortly to further encourage customers to move to Instana. A full list of supported technologies is available here.
Essentially IBM’s approach is:
- For any new customers and new projects promote Instana. This essentially will be for workloads in the cloud and Kubernetes environments.
- Develop agents/sensors to meet their current customer’s needs so that existing customer monitoring can be migrated to Instana over time.
- Integrate the Mainframe zAPM connect connection into Instana.
- Maintain current products for existing customers.
- Suggest that all products (Both IBM and 3rd party) feed into IBM’s Watson AIOps portfolio.
Personally, I think this acquisition is a good one. We have been noticing a trend amongst our customers to look at other vendors monitoring tools and the old IBM Monitoring products have started to look increasingly dated. IBM have updated some of the products and introduced some new ones too, but I think it was becoming difficult to know what product to suggest. Instana immediately fixes that issue for IBM and for us as a business partner. I think it may well be the answer for IBM’s customers too. In a recent article by APM Experts they ranked Instana as number one for Observability. The only negative score they gave was for Log Management but as IBM and Orb Data both partner with Humio already we have that area covered.

If you would like to trial Instana or talk more about how it can replace your existing tools then please email me at Simon.barnes@orb-data.com
Views: 3925