
IBM Topology Manager
DevOps Teams and Operations Teams are responsible for managing highly distributed and increasingly complex hybrid networks consisting of physical and virtualized infrastructure. Services and applications may span both on-premises systems and cloud-based solutions. The dynamic nature of the virtual infrastructure provides new challenges for all support teams.
Topology Manager, formerly Agile Service Manager (ASM), provides vital real-time visibility of highly dynamic infrastructure and services. It assists DevOps Teams quickly identify the “blast radius” of an issue, distinguish root-cause and symptom events, visualise topology changes at the time of issues and ultimately resolve those issues more swiftly.
This blog will review how Topology Manager achieves this and highlight the key benefits for DevOps and Operations teams.
Using Topology Manager
So, what are the use cases for Topology Manager?
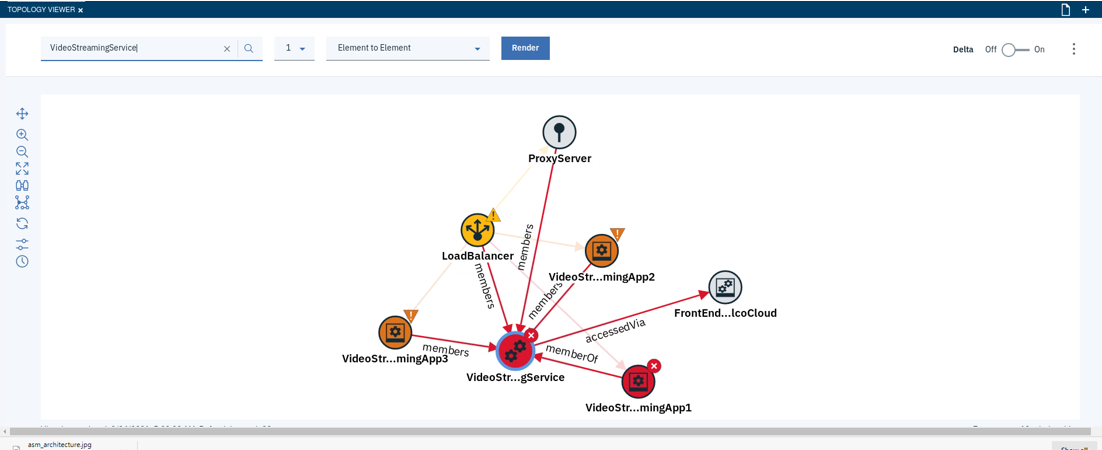
The Topology Viewer enables the user to search for a named resource, view status information for the resource and display a topology including resources up to 4 hops from the identified resource. The topology view overlays the status information on the topology map, clearly indicating the relationship between failing resources and the knock-on effect of issues.
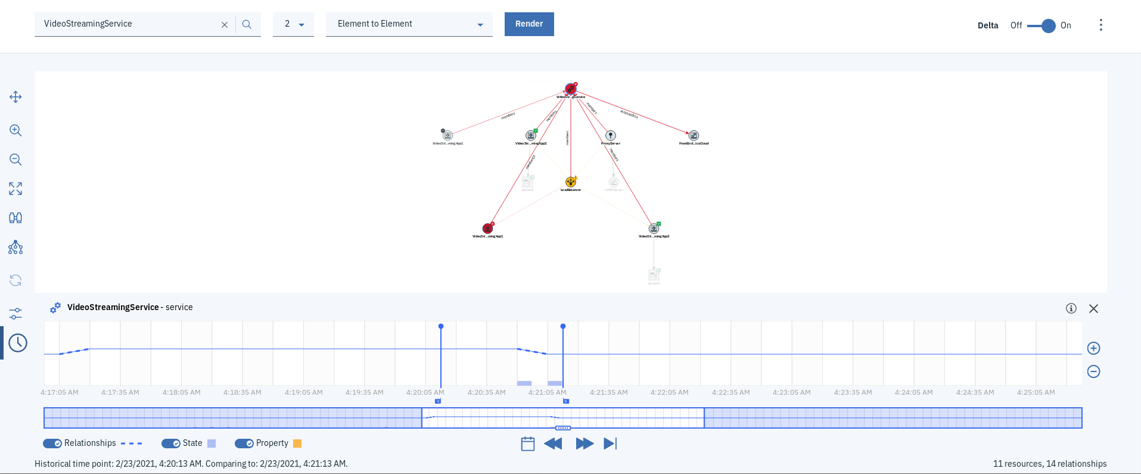
DevOps Teams can launch directly into the Topology Viewer from various tools within Netcool OMNIbus Event Viewer. The delta view overlays topology differences between the time an event was generated and one minute before the event. This enables resource changes to be easily identified, and engineers to understand how the status of resources changes over time, ultimately leading to quicker root-cause identification and issue resolution. The time delta can be adjusted by dragging the “pins” shown in the below screenshot.
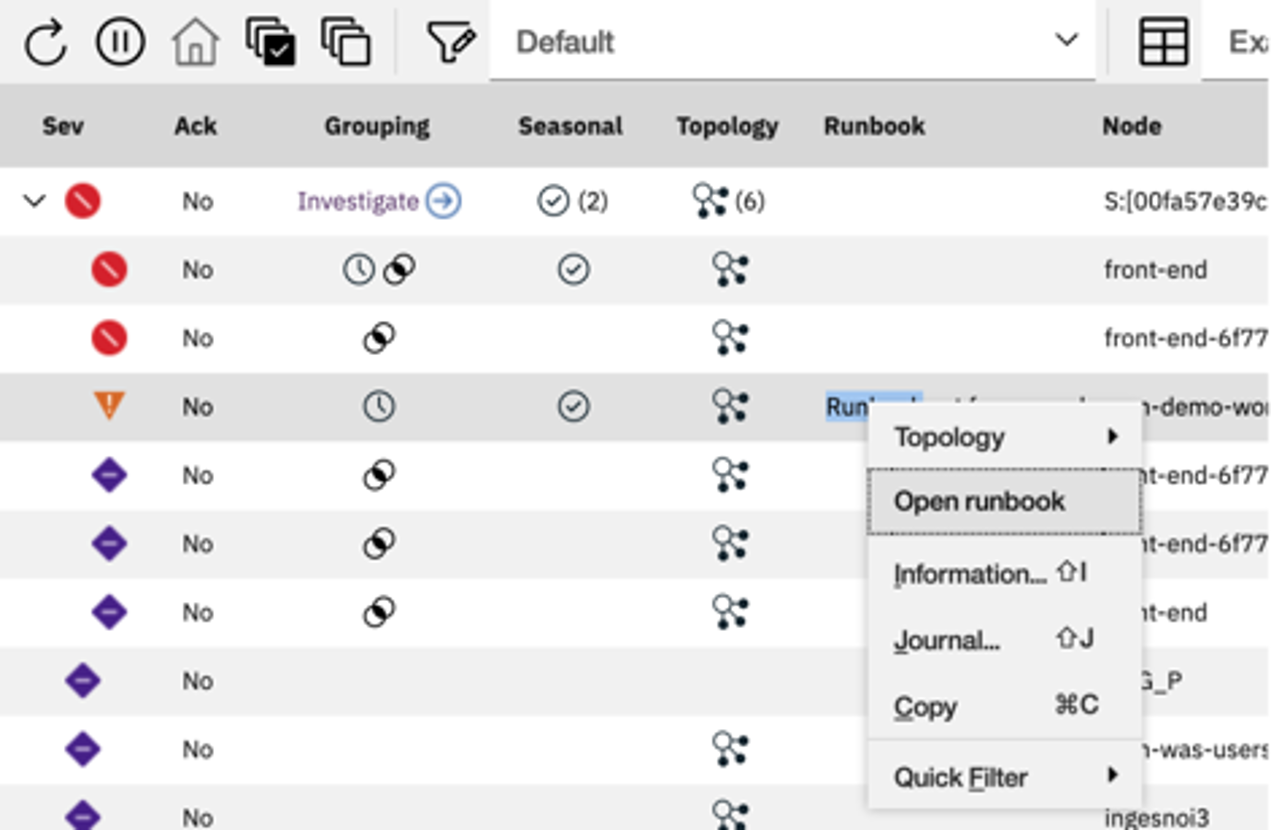
Additionally, the topology data can be utilised by the Cloud-Native Event Analytics engine, a component of Netcool Operations Insight (Watson AIOps Event Manager). Cloud-Native Event Analytics uses streamed event data to identify temporal relationships between events, i.e. events that tend to occur at the same time, and seasonal events, i.e. events that tend to occur at the same time of day, day of week, or day of month. This information can be used to group events with a temporal relationship or suppress seasonal events that require no operational response. The topology data adds a further layer of grouping, grouping events related by topology. DevOps Teams immediately see related events, from distributed resources, grouped together and can respond swiftly to resolve issues.
Building the Topology Database
Topology Manager builds the topology database both from existing sources and by active discovery of networks and applications. Resource types, resource relationships and resource status is stored in a Graph DB. Data from multiple sources is merged to deliver a consistent and complete picture of the resources and the relationships.
There are over 100 different resource types supported out of the box by Topology Manager, and administrators can add custom resource types if necessary. Default resource types cover networks, cloud-native technologies, data centres, application and services, for example, default resource types include firewall, switch, pod, container, air conditioning, chassis, process and command.
Topology Manager exploits data from existing solutions that maintain a partial view of infrastructure, service or application resources and relationships, for example, application performance management tools or change management systems. Topology Manager Observers continually ingest data from those solutions and, where available, the status of the resources. Observers are available for many technologies, including CISCO ACI, AWS, GCP, Microsoft Azure, AppDyanmics, Dynatrace, ServiceNow, Docker Networks, Kubernetes and OpenStack. Multiple Observers will be deployed in a given Topology Manager instance to build the full picture for the environment.
Topology Manager can also actively discover resources using Discovery Services. The discovery services query discovered resources to identify their type, relationships and status. The two discovery services available are containerized versions of known and trusted IBM solutions, IBM Tivoli Network Manager and Tivoli Application Dependency Discovery Manager. Note that there are also observers available for both ITNM and TADDM to enable Topology Manager to ingest data from existing instances of those tools.
Critically, a historical record of the topology data is maintained for up to 28 days, data exploited by the Netcool OMNIbus Web GUI integration, as demonstrated above.
Resource Status
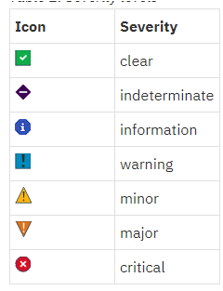
The health of a resource is represented by its status. The status may be Clear, Indeterminate, Warning, Minor, Major Critical. Status data can be collected by Observers and Discovery services, where available, but also correlated with events from Netcool OMNIbus, the event management solution. It is in such environments, where Topology Manager is integrated to Netcool OMNIbus, that the DevOps and Operations Teams benefits can really be exploited.
Topology Manager Installation
Topology Manager can be installed on-premises or on-cloud and as a standalone deployment or part of the Netcool Operations Insight or Watson AIOps (see this Blog for a high-level comparison of the products).
A standalone deployment, delivered as a set of Docker containers or within Red Hat OpenShift, can be integrated into an existing Netcool OMNIbus instance to deliver in-context launch-out from events to the Topology Viewer.
Netcool Operations Insight on Red Hat OpenShift, delivers a fully integrated Topology Manager and Netcool solution, with in-context launch to the Topology Viewer and Event Analytics integration, maximising the ROI from the Topology data.
If you have any question on Topology Manager or would like to arrange a demonstration, please contact Orb Data at info@orb-data.com.
Views: 815