
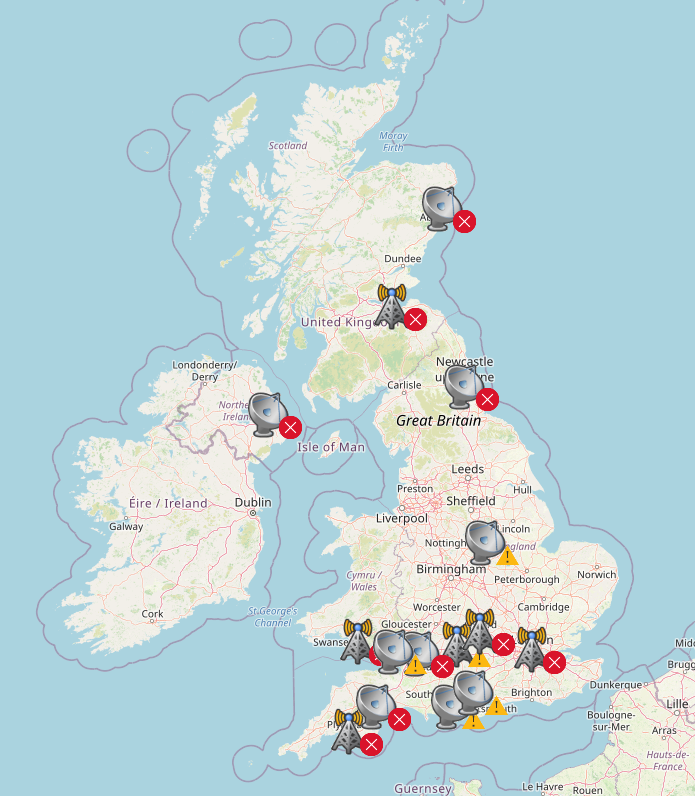
Executive dashboards are a vital part of any operations centre. For businesses with nationally or internationally distributed resources, for example branches, stores or data centres, plotting status information for those locations on a geographic map provides useful insight to the overall service.
Historically, maintaining a Netcool dashboard to display location status on a geographical map was a manual task within Web GUI. Jazz for Service Management version 1.1 added the Map widget that enables the generation of such dashboards to be automated using some basic data location information.

The example above uses a simple Impact policy to identify the status of each unique location (the maximum severity) via a query to the event management server, in this case the Netcool ObjectServer. The policy uses that information to identify a status image and the coordinates of the location. The coordinates of each location are held in an external database, in a production environment that would likely be a CMDB, for example ServiceNow.
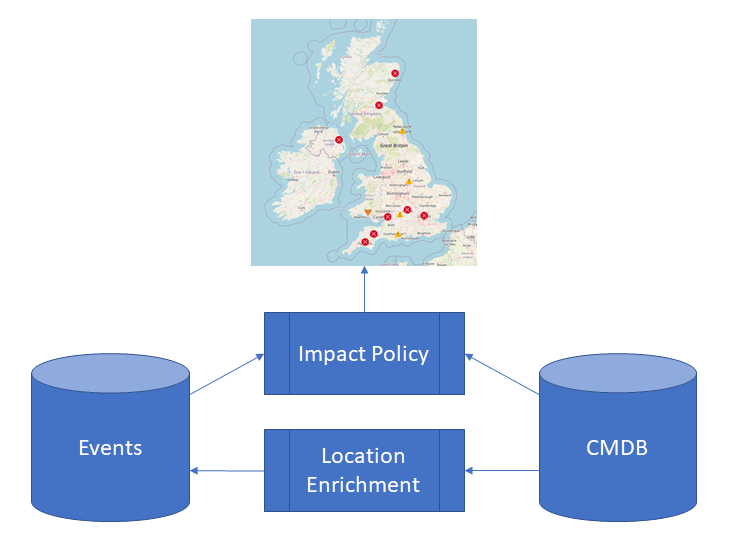
The data returned by the Impact policy is an array of objects. Each object represents a point to plot on the map and includes the Latitude, Longitude, Status and Status Image. An optional label and/or tool-tip can enhance the user experience.

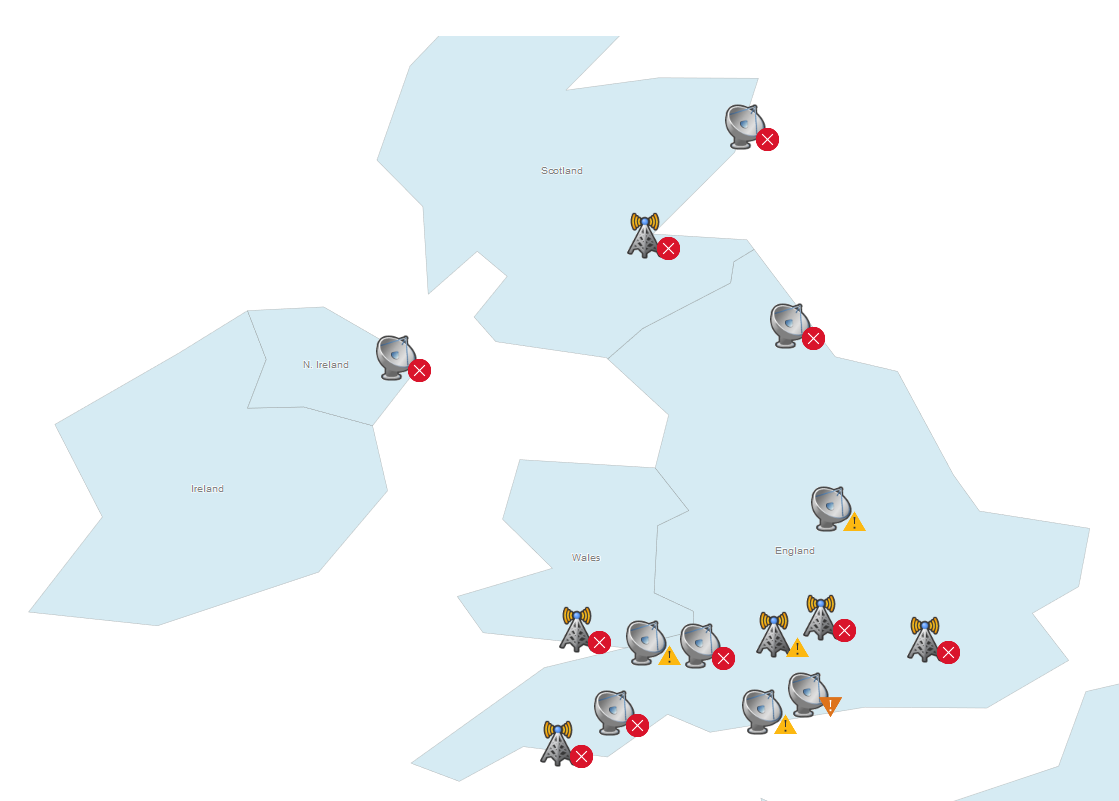
Further refinements are possible using a resource image, this could be used to distinguish different location types, for example store brands or tele-communications technologies. Again, this would likey be driven by CMDB data.
For an executive dashboard, the Refresh widget is useful to enable the users to define the desired refresh interval.

The map source can be configured to use Open Street Maps, local maps, Google Maps or Bing. The latter two services require an API key to be defined. The local option is a basic schematic map.
The nature of features of Jazz SM and Impact mean that the underlying status information does not need to be located in Netcool, Impact could integrate to any event management system.
Orb Data have also developed similar executive dashboards using Grafana, this may help expose the dashboard to a wider audience. The Orb Data blog Visualising Netcool/OMNIbus Data with Grafana describes how Grafana can be integrated to Netcool data to drive such dashboards.
Views: 334