
![]()
Is your Nagios renewal coming up? Let us quote and we will guarantee to beat your normal price. Take a look here to get an initial quote without any sales interaction.
I was recently asked by a customer to integrate Nagios with Service-Now and after looking into existing options I came across only one and which was a deprecated tool. So I decided to write an integration for the customer and wanted to share what was achieved.
I am starting off with a Nagios XI instance, for those unaware, XI is an amazingly feature-rich front end that is the commercial offering from Nagios themselves. It makes Nagios far more user-friendly and brings some much-needed configuration management for Nagios. We have implemented it for a few customers and all of them were equally impressed with this nifty front-end and its affordability.
Theoretically, this solution is compatible with any Nagios implementation (or any solution that uses a Nagios Core as its engine) that uses event handlers, such as Centreon. op5, Sensu using a pipe handler, etc. so it’s not restricted to Nagios XI to perform the core functions, however, Nagios XI APIs have been taken advantage of to enrich the Incidents with more details.
Pre-requisites
I am using a vanilla Service-Now instance and I will use the default Incident table. In this case, I scripted against the ‘Fuji’ release. I have used the default fields available in this release to map various Nagios variables and this could change in your environment depending on the level of customization you have in Service-Now. I have added a couple of extra fields to store URLs (explained later) in Service-Now but decided to use defaults in the Incident table for the rest of the fields to keep it friendly with other Service-Now instances.
I created a dedicated service user for the Nagios event handler to use, this user will need the ability to do CRUD operations on the Incident and Configuration tables. *N.B.: Access to the configuration table is only required if you want to populate CMDB as part of the Incident creation as I have scripted so it will also create an entry for a host-based on information in Nagios if it doesn’t exist in ServiceNow’s CMDB, if an entry already exists then it will simply populate the field.
On the Nagios end, we need to update Nagios to use a custom event handler… this can be done by changing the global default event handler however if you want a more granular approach you can update the hosts and service templates that your hosts and services inherit from.
I have chosen to update the hosts and service templates to use the custom event handlers that I have built. These custom event handlers get all the necessary notification variables passed in from Nagios which is then passed on to a custom script to forward to Service-Now.
The script does most of the heavy lifting and I will detail some of its features here, I intend to add more as we get more requirements from customers.
Host Events
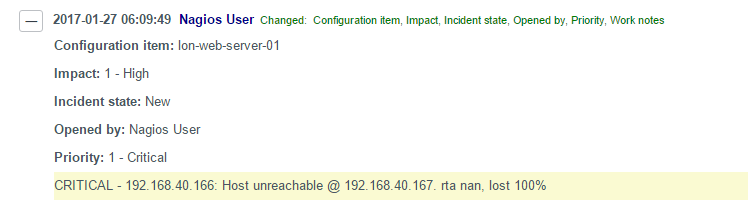
Upon a host down / unreachable hard event (by default on the 5th consecutive failure), it will invoke a python script and raise a ticket in Service-Now… it will populate the following fields:
Short Description: A summary of the issue, typically the title of the alert.
Impact: Service-Now impact field, together with urgency field Service-Now will set Priority.
Urgency: Service-Now urgency field, together with impact field Service-Now will set Priority.
CMDB CI: The node will be populated and if a CMDB entry is present, it will be linked. If not found then an entry will be created based on the information from Nagios.
Assignment Group: By default will assign to a ‘Service Desk’ group defined in Service-Now, but based on the ‘Host Group’
Category: Service-Now’s incident category field, set to ‘hardware’ by default.
Work Notes: An output from the command is entered here.
Graph URL: A link to the host performance graph
Rapid Response URL: A link to the host/service in question to Suppress/Acknowledge/Comment to view in more detail within NagiosXI
The workflow of the host-related event handling is outlined below:
An example of how this looks in the queue and the incident details are shown below:
In the Incident details, you will find a Graph URL and a Rapid Response URL: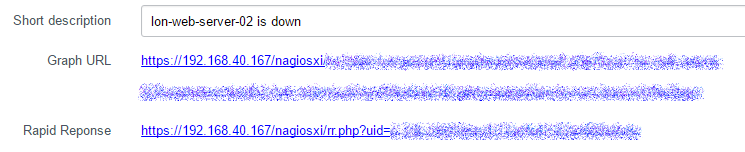
Graph URL
Is made possible by the Nagios XI backend API component that exposes the host graph, you will need to use a user account to generate the API token for the URL to run a read-only query to pull back the graph for the host. It will take to an interactive graph for the host in question: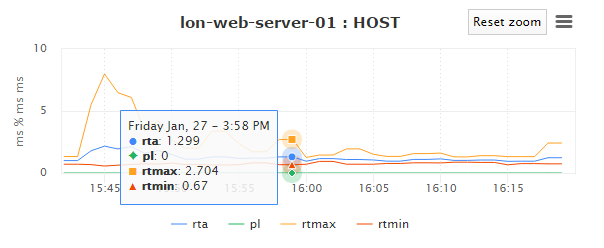
This does not allow any access into NagiosXI, it’s only used for getting the performance statistics.
Rapid Response URL
Is something Nagios XI’s default email handler uses and it allows you to quickly jump to the issue to Acknowledge, Suppress alerts, View further details, etc. and comes in very handy. I had to query the database to construct this URL based on what’s being alerted on. If it’s a host down alert, clicking on the Rapid Response URL will take you to the following options:
On a side note, Rapid Response link is pre-authorised by default but if you wish to force users to login after using the rapid response URL then just edit the below config file:
/usr/local/nagiosxi/html/config.inc.php
and update the properties as stated below:
// Secure notification %responseurl%
// setting this to 1 will force users to login in the response URL
$cfg['secure_response_url']=1;
Once changes are made, restart the apache server for the new settings to take effect:
service httpd restart
Service Events
Service events would follow the same workflow as that of host events, populate similar fields. The difference is in the way event handler passes on information and the severity mapping. In Service-Now, ‘Priority’ of incidents is worked based on Impact and Urgency (as per ITIL suggestion).
In Nagios, we have four levels of severities (including resolution) that need mapping to a combination of Impact and Urgency… I have chosen the below model but you could modify to fit your requirements:
Graph URL
For service events, this would be based on the service in question… An example of CPU Usage graph is shown below:
Similarly, Rapid Response would take you to the service in question: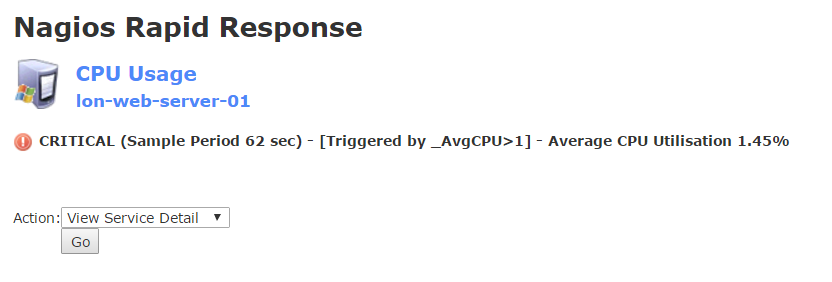
Logging
The ticket raiser and updater, will log all actions and when turned into full debug mode would also print all the JSON responses and other exceptions. Some logs examples:
2017-02-06 11:44:21,376 - __main__ - INFO - Incident: INC0010147 raised with priority: 1, short description set to lon-web-server-01 is down with sys_id d86754510f30320093da943be1050ed2
2017-02-06 13:27:15,955 - __main__ - INFO - Incident: INC0010148 raised with priority: 2, short description set to CPU Usage on lon-web-server-01 has a problem with sys_id bbee24510f30320093da943be1050eba
2017-02-06 13:27:13,078 - __main__ - DEBUG - Parameters passed in, Short Description: CPU Usage on lon-web-server-01 has a problem, Impact: 2, Urgency: 1, CMDB_CI: lon-web-server-01, Assignment Group: Service Desk, Category: hardware, Work Notes: CRITICAL (Sample Period 62 sec) - [Triggered by _AvgCPU1] - Average CPU Utilisation 1.45% Perf Data: Avg CPU Utilisation=1.45%;80;1;, Service Description(optional): CPU Usage
Further Considerations
Exceptions… exceptions…
It’s almost inevitable in any environment to eventually hit an exception where you want the tickets handled differently or not raised at all. I wanted to try and manage the exceptions better than some of the ‘hard-coded’ expectations. We can achieve this by having a simple csv that is maintained with the exception of hosts or having a custom table in MySQL that we can loop through before proceeding to raise the ticket.
My preference is to keep this as centralized as possible, maintaining a flat file/database table can end up being a chore and certainly less ‘visible’ to an end-user/another admin as to what’s being handled differently and why – which can result in chaos and confusion… all too familiar with that.
So I wanted to use a host group/service group in Nagios to try and maintain a list of hosts and services that do not raise a ticket. Nagios XI exposes an API that will allow me to query if the host/service coming through the event handler is part of this group and if it is I can log and exit out.
You could achieve notification suppression with maintenance mode, but that would disable all notifications and you may still want emails for these hosts/services. Hence having host/service groups setup in Nagios XI would help seperate the workflow.
However, the exceptions can be more complex than just a yay/nay on ticket creation. Hence having a host group/service group per exception rule may be a better option and so you could have one list for hosts/services that do not need a ticket created and have another group of Dev/Test hosts/services which then continues to raise tickets but reduces the severities to fit accordingly.
A one-size-fits-all approach will not work for all exceptions in ticket handling but having the most common types of exceptions managed would be a great start.
Service-now Incident Synchronisation
Synchronizing the work notes from an open Incident that is added into Nagios hosts/services comments would be ideal, this should be achievable but it would need a custom database table to maintain a record of Incident Numbers / sys_id and to maintain the last record read, etc.
There is also the possibility that the Incident raised by Nagios is closed by an Agent on Service-Now, but the Nagios service hasn’t actually recovered… This introduces the possibility of tickets being closed but services having not recovered and hence the possibility of services to continue to degrade without further notifications. Ideally, agents shouldn’t be allowed to close the tickets unless it’s cleared on Nagios as well, this can be achieved but needs some input from Service-Now end to extend it on their end to do that.
If that’s not an option then we can periodically check the state of the Nagios hosts/services vs the Incident raised and see if they match their states and if not, re-open the ticket. Again, this would need a database table with the relationships mapped to achieve that.
If you’d like to discuss your requirements or want to have this implemented in your environment, feel free to email info@orb-data.com
Views: 1746